The process for creating a column chart is very similar to the process of creating a scatter plot. The main idea is the same: get the data into the spreadsheet, add the appropriate chart type to the spreadsheet, and then edit the chart so that Excel knows where to look for the data.
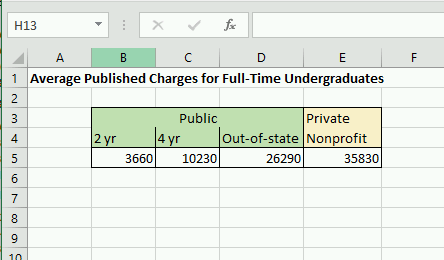
In this example, let’s compare the average cost of tuition for a few different types of Universities. This data is real (and kind of frightening! whew private colleges are pricey) and comes from collegeboard.org at the time this was written (so may be slightly different now, but you can use current data if you want!) To start, make the following spreadsheet (Figure 6.5.1 below). Again, it behooves you to make it exactly the same as my chart below.
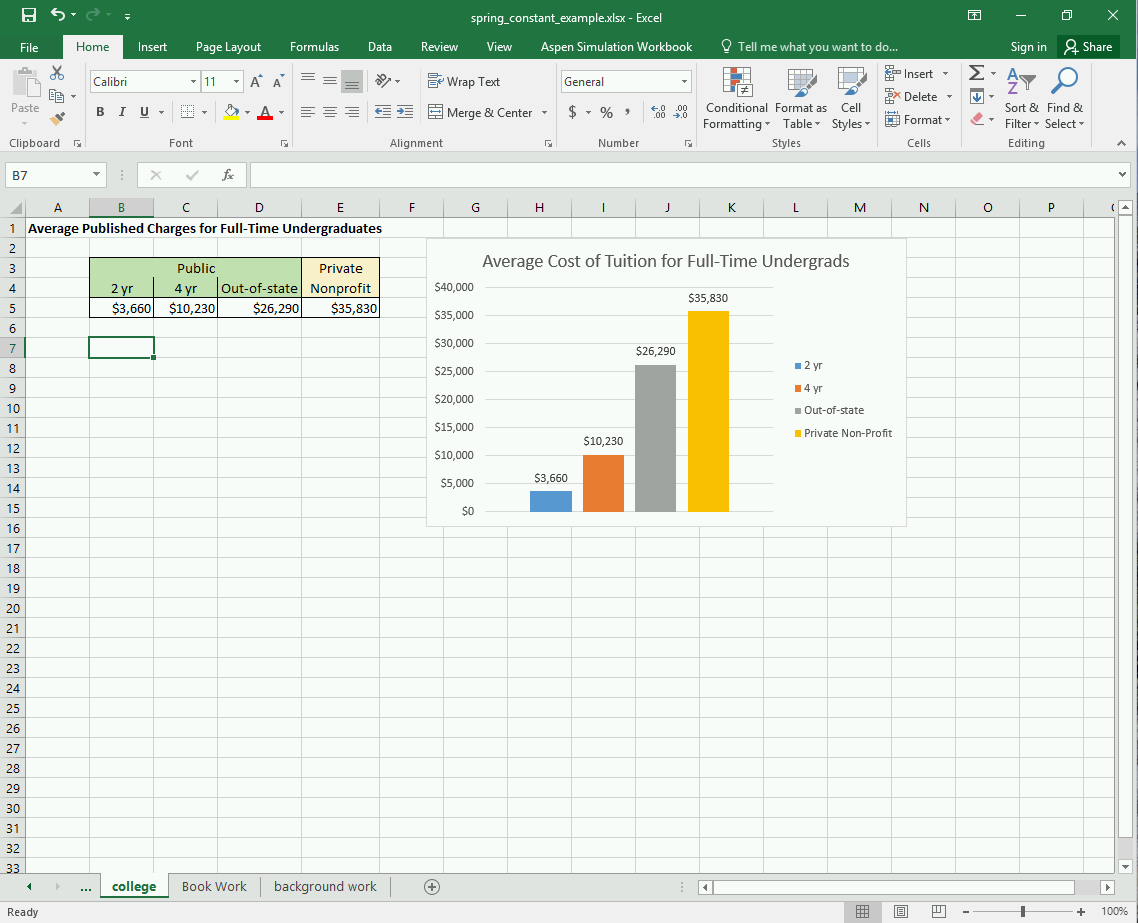
Since we are comparing these 4 values, it makes sense to use a column chart. Since these are dollar amounts, we should learn how to have Excel display them as currency. To do this, select all the cells that contain the dollar amounts, then right-click and select the “Format cells…” menu item. From there, you will see several options (again, it is a good idea to explore these on your own) but the one we are interested in is located under the “Number” tab. Select the “Currency” option, reduce the decimal places option to 0 (or leave it at 2, your call), then click Ok. The cells should automatically populate with dollar signs. Cool!
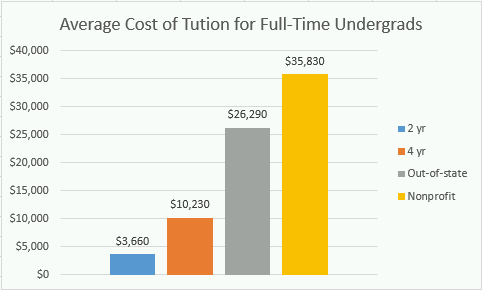
Now that the cells are formatted nicely, the next step is to insert the column chart. The process here is very similar to inserting a scatter plot. This is another good brain workout opportunity. Try and figure out how to create the column chart on your own, remembering that the process is almost identical to the scatter plot! Try and use the “Add Chart Element” options to create the chart shown in Figure 6.5.3 Try and make it as close to the exact same thing as possible.
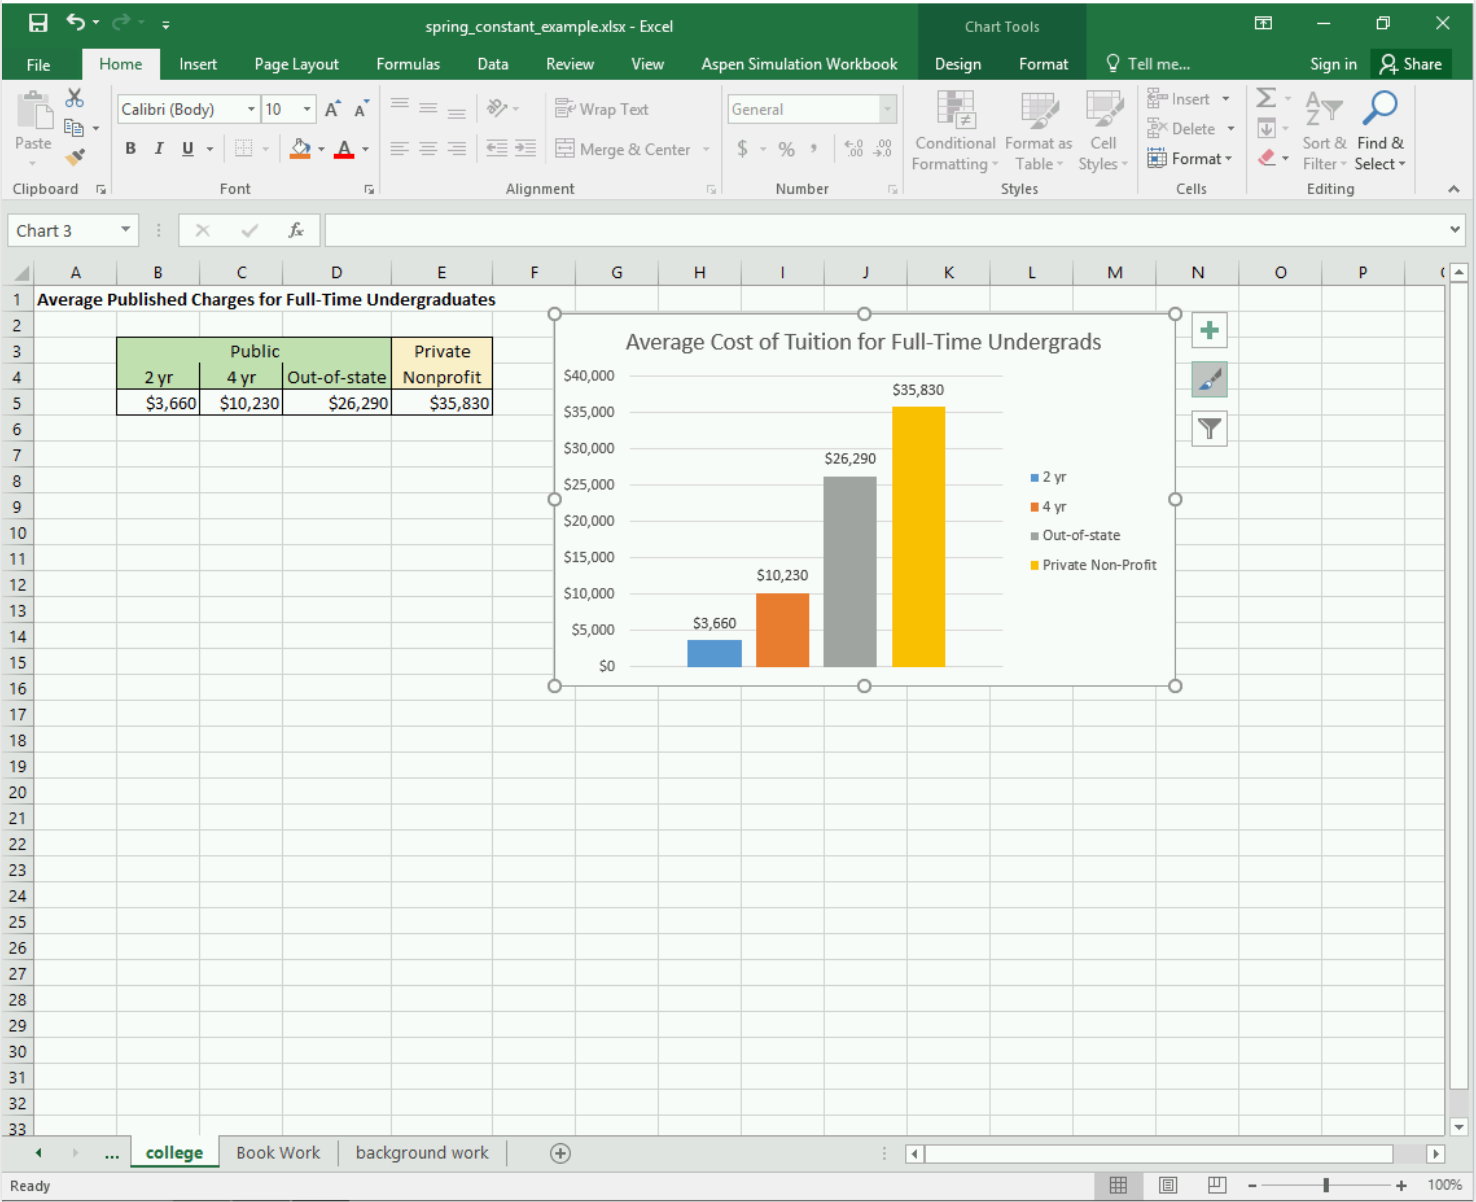
Look at the following screenshot. You should notice that the main ribbon does not have the “Chart Tools” section which we would need to access the “Add Chart Elements” menu to add items such as a legend or grid lines. Why is this ribbon item missing?