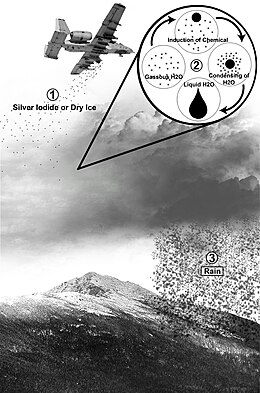
The 2024 movie Twisters mentions how injecting silver iodide into clouds can convert atmospheric moisture into rain. Scientists have long considered this for increasing rainfall in drought regions. In one study, researchers in southern Florida explored whether injecting silver iodide into cumulus clouds would lead to increased rainfall. On each of 52 days that were judged to be suitable for cloud seeding, a target cloud was identified and a plane flew through the target cloud in order to seed it. Randomization was used to determine whether or not to load a seeding mechanism and seed the target cloud with silver iodide on that day.
Radar was used to measure the volume of rainfall from the selected cloud during the next 24 hours. The results below and in CloudSeeding.txt (from Simpson, Olsen, and Eden, 1975) measure rainfall in volume units of acre-feet, “height” of rain across one acre.
Experiment because the researchers decided which clouds were seeded. This was done with random assignment and presumably the pilots were blind to whether or not they were seeding a cloud and the person evaluating the rainfall was blind to whether or not that cloud had been seeded.
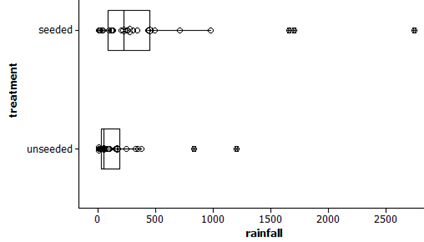
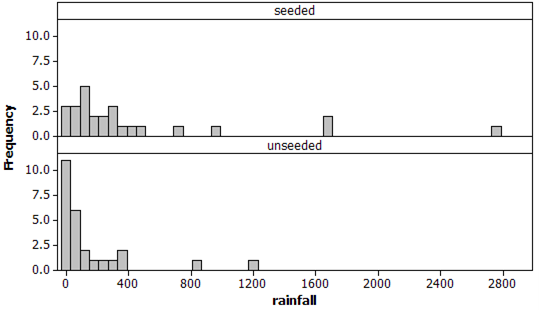
Based on the graphs and summary statistics, is there preliminary evidence that cloud seeding is effective? (Include a calculation of the difference in the group means and in the group medians.)
There does appear to be a tendency for the seeded clouds to have more rainfall than the unseeded clouds. The dotplot is shifted slightly to the right of the dotplot for the unseeded clouds and all five numbers in the five number summary are larger for the seeded clouds.
Both distributions are strongly skewed to the right (skewness values 2.44 and 2.79) and the sample sizes are not huge, so we might be hesitant to apply the two-sample t-test to these data.
Regardless of your answer to Question 4, carry out a two-sample t-test and a confidence interval to determine the strength of evidence of higher average rainfall with the seeded clouds.
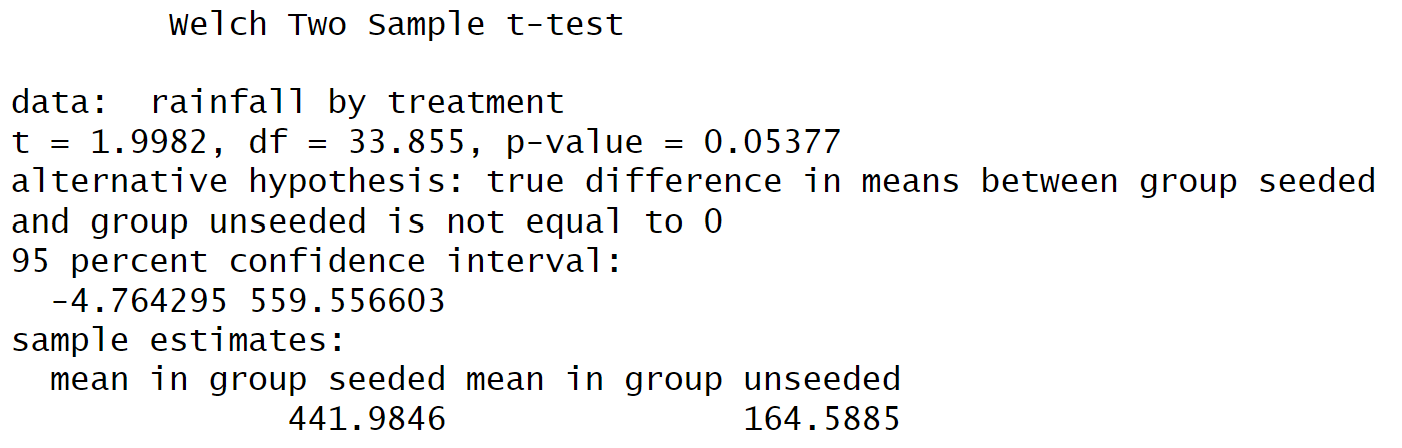
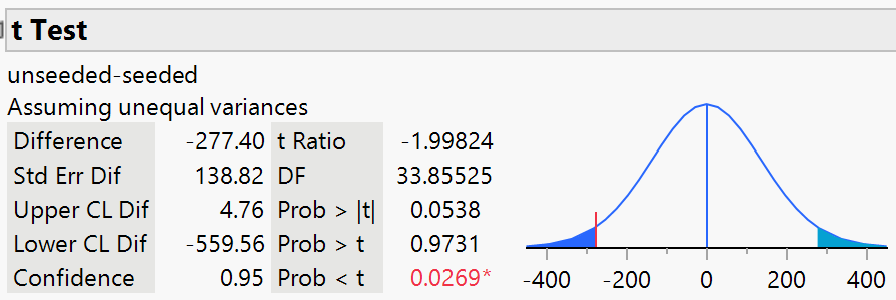
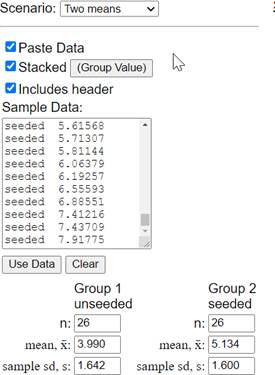
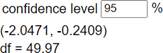
Using technology, the two-sample t-test gives a two-sided p-value = 0.054. We have moderate evidence of a difference in the mean rainfall for these two treatments. The one-sided p-value can be found by taking \(0.054/2 = 0.027\) because the observed difference is in the conjectured direction. We have strong evidence that, on average, seeded clouds have more rainfall than unseeded clouds.
But if we don’t totally trust these results, what other approaches have you learned that could be applied here instead of a two-sample t-test to assess the statistical significance of the difference in group means? (See Investigation 2.8 10.2 for a similar situation.)
Simulation - we can use the random assignment applet to approximate the p-value. We could also consider analyzing the difference in medians instead of means, or transform the data (e.g., log transformation) to make the distributions more symmetric.
One approach to compensate for the skewness and outliers in these rainfall distributions is to analyze the difference in medians instead of the difference in means. Fortunately, an advantage of the randomization test is that it applies just as well, and just as easily, to comparing medians.
Modify the previous code from the Technology Detour in Investigation 4.4 (remember to load/attach the CloudSeeding.txt data, to match the sample sizes in the actual study, and to consider the difference in medians as the statistic), or use the Comparing Groups (Quantitative) applet, to calculate an empirical p-value for the difference in medians for this study.
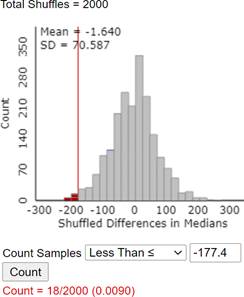
The observed difference in medians is \(-177.4\) (unseeded minus seeded, or \(177.4\) for seeded minus unseeded). Using simulation (e.g., Comparing Groups Quantitative applet), the p-value is approximately 0.009. This provides strong evidence that cloud seeding increases the median rainfall amount.
Would it be reasonable to model the randomization distribution for the difference in medians with a normal or t-distribution? Explain. What about creating a confidence interval using statistic ± 2SD? What would this interval tell you?
The distribution looks a little strange, not nearly as nicely bell-shaped and symmetric (and filled in) as the distribution of the differences in sample means. It would probably not be appropriate to model with a normal or t-distribution, and therefore a 2SD interval for estimating the difference in population medians, may not be valid either.
Although we can certainly use simulation this way to approximate the p-value, it is not feasible to find the “exact” randomization distribution for a data set of this size. We also notice that the distribution of the difference in medians has less “smoothness” than the distribution of the differences in means, as certain combinations of values are just not possible from a discrete distribution.
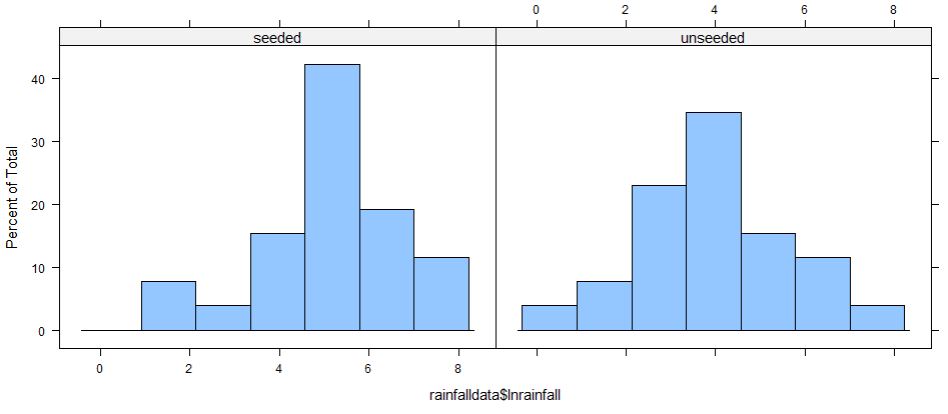
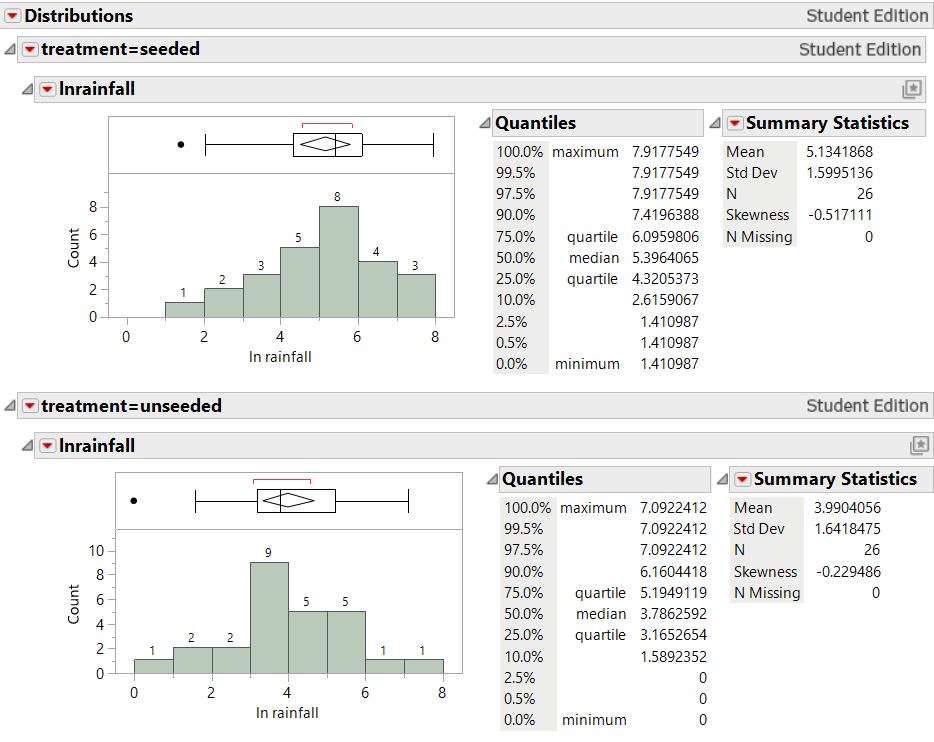
Yes, both distributions are more symmetric (skewness values much closer to zero) and the variability is more similar between the two distributions (both SDs around 1.6). There is still evidence of a positive shift in rainfall amounts for the seeded clouds.
Yes, now we have symmetric data without huge outliers. The variability is similar in the two groups and the seeded distribution is shifted a bit to higher values. These sample distributions appear symmetric enough to justify applying the two-sample t-procedures.
Using two-sample t-procedures on the log-transformed data gives a p-value of approximately 0.007 (one-sided) and a 95% confidence interval of approximately (0.24, 2.05) for the difference in mean log rainfall (seeded minus unseeded).
How does this p-value compare to what you found from simulating a randomization distribution for the difference in medians? What conclusion would you draw from this p-value?
This p-value (0.007) is a little smaller than the empirical p-value (0.009) from the randomization test on medians. We would consider this p-value very strong evidence against the null hypothesis of no treatment effect.
It is fairly straight-forward to “back-transform” our transformation by exponentiating the endpoints of the interval. But we will again focus on the median rather than the mean as the transformed parameter. Also exponentiating an interval for a difference really gives us a ratio in the original scaling \([e^{\mu_1-\mu_2} = e^{\mu_1}/e^{\mu_2}]\text{.}\) In other words, if group 1 is 2 points higher than group 2 on the log scale \((\mu_1 = \mu_2 + 2)\text{,}\) then group 1 is \(e^{\mu_2+2} = e^{\mu_2}(e^2)\) or 7.4 times higher in the original scale (or 100 times larger on the log base 10 scale). Therefore, once we apply the back-transformation, we really have an interval of plausible values for the multiplicative change in the median of the response variable.
The rainfall distributions reveal that the rainfall amounts from the seeded clouds have a larger mean and larger variability than from unseeded clouds, and both groups have very right-skewed distributions of rainfall with several high outliers. As both the centers and spreads change, perhaps the treatment effect is more of a percentage change than a simple shift. A two-sample t-test may not be valid for these data. We could consider a randomization test on the medians, but there is no theory-based confidence interval. This is a situation where a ln-transformation is likely to be helpful in rescaling the data so that the t-procedures are more valid. Examining graphs of the transformed data confirm that the variability is now more similar and both shapes are symmetric. The two-sample t-test applied to the ln-transformed data can thus be used as an approximation to the randomization test. Also, the confidence interval for the difference in the ln rainfall can be back-transformed to provide a statement about the multiplicative treatment effect of cloud seeding: We are 95% confident that the median volume of rainfall on days when clouds are seeded is 1.3 to 7.7 times larger when clouds are seeded as opposed to when they are not seeded. (Increasing from 164.59 to 441.98 acre-feet in the sample.) Because random assignment was used to assign the clouds to the seeding conditions, it is safe to interpret this as evidence that the seeding causes larger rainfall amounts on average.
Although the transformation again gives us a comparison of medians, which is often preferable with skewed data and/or outliers, keep in mind, sometimes we really prefer the parameter to be a mean than a median, such as when you want to focus on the “total” amount (population mean × population size).
Checkpoint21.4.2Randomization Distribution for Means.
Examine the randomization distribution for the difference in means (and/or t-statistic). Do the t procedures end up being a reasonable approach for these data?