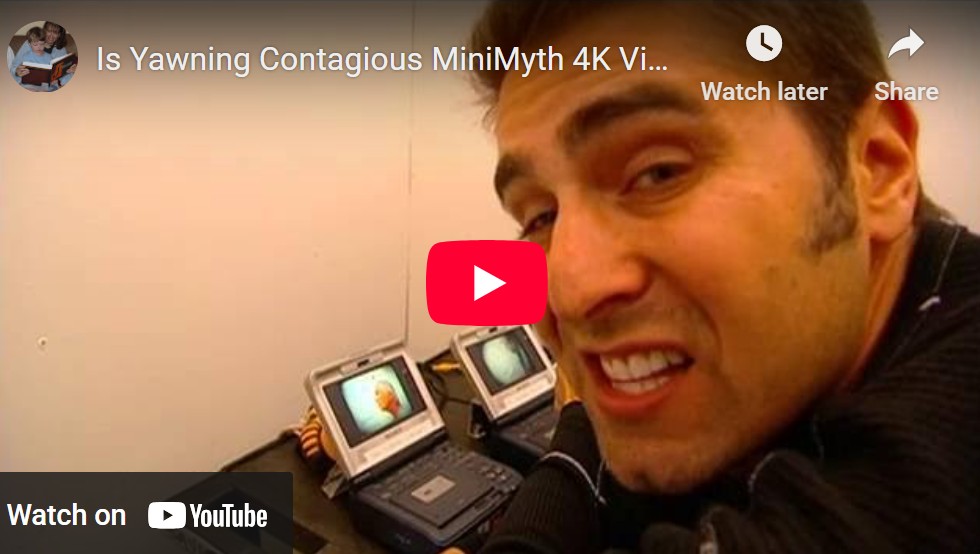
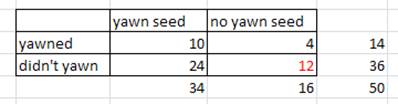
The folks at MythBusters, a popular television program on the Discovery Channel, investigated whether yawning is contagious by recruiting fifty subjects at a local flea market and asking them to sit in one of three small rooms for a short period of time. Video snippet
For some of the subjects, the attendee yawned while leading them to two of the rooms (planting a yawn "seed"), whereas for the other subjects the attendee did not yawn while leading to a third room. As time passed, the researchers watched (via a hidden camera) to see which subjects yawned.
Define the relevant parameter of interest, and state the null and alternative hypotheses for this study. Be sure to clearly define any symbols that you use.
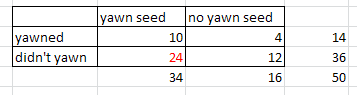
In the study they found that 10 of 34 subjects who had been given a yawn seed actually yawned themselves, compared with 4 of 16 subjects who had not been given a yawn seed.
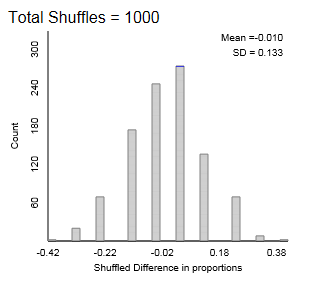
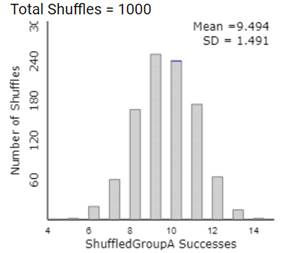
50 cards: 14 red, 36 blue. Shuffle. Deal out 34 to "group A." Record the number of red cards in Group A. Repeat many times. Calculate the proportion of red-card-counts that are 10 or higher.
Paste in the raw data and press Use Data or enter the titles and counts of a two-way table and press Use Table. (Or check the 2×2 box and enter the cell values and headers). Or use the version below.
Then indicate whether the research conjecture expected a larger or smaller number of successes in the seed treatment by choosing Greater Than or Less Than from the pull-down menu.
The simulations you have conducted in Investigations 3.5 (Dolphin Therapy) and above approximated the p-value for two-way tables arising from random assignment by assuming the row and column totals are fixed. In this case, the probability of obtaining a specific number of successes in one group can be calculated exactly using the hypergeometric probability distribution. (We used the independent binomial distributions with the teen hearing loss study, where we wanted to sample separately from two populations and the overall number of successes was not fixed in advance.)
Keep in mind, that under the null hypothesis, we are assuming the group assignments made no difference and that there would be 14 successes ("yawners") and 36 failures ("non-yawners") between the two groups regardless.
Because the random assignment makes every configuration of the subjects between the two groups equally likely, we determine the probability of any particular outcome for the number of yawners and non-yawners by first counting the total number of ways to assign 34 of the subjects to the yawn-seed group (and 16 to the no-yawn-seed group) in the denominator. The numerator is then the number of ways to get a particular set of configurations for that group, such as those consisting of 10 yawners and 24 non-yawners.
How many ways altogether are there to randomly assign these 50 subjects into one group of 34 (yawn-seed group) and the remaining group of 16 (no-yawn-seed group)?
Recall what you saw earlier with the binomial distribution and counting the number of ways to obtain S successes and F failures in \(n\) trials. See the Technical Details in Investigation 1.1.
How should you combine these two numbers to calculate the total number of ways to obtain 10 successes and 24 failures in the yawn-seed group, the configuration that we observed in the study?
To determine the exact probability that random assignment would produce exactly 10 successes and 24 failures into the group of 34 subjects, divide your calculation in Question 8 by your calculation in Question 7.
The probability of obtaining \(k\) successes in Group A, with \(n\) observations, when sampled from a two-way table with \(N\) observations, consisting of \(M\) successes and \(N - M\) failures is:
where \(C(N, n) = \frac{N!}{n!(N - n)!}\) is the number of ways to choose \(n\) items from a group of \(N\) items, and \(X\) represents the number of successes randomly selected for group A. \(X\) is a hypergeometric random variable. Also note \(E(X) = n(M/N)\) and \(SD(X) = \sqrt{n(M/N)(1 - M/N)(N - n)/(N - 1)}\text{.}\)
In this study, we had \(N = 50\) subjects and we defined yawning to be success so \(M = 14\text{.}\) We also arbitrarily chose to focus on the yawn-seed group, so \(n = 34\text{.}\) This calculation works out the same if you had defined "not yawning" to be a success and/or if you had focused on the 16 people in the no-yawn-seed group. You just need to make sure you count consistently.
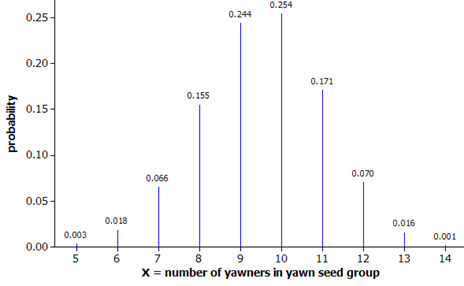
We will continue to define the p-value to be the probability of obtaining results at least as extreme as those observed in the actual study. Because we expected more yawners in the yawn-seed group, the p-value is the probability of randomly assigning at least 10 of the yawners in the yawn-seed group.
Sum all five probabilities together (including P(X = 10)) to determine the exact p-value for the yawning study. How does this p-value compare to the empirical p-value from the applet simulation? Write a one or two sentence interpretation of this p-value.
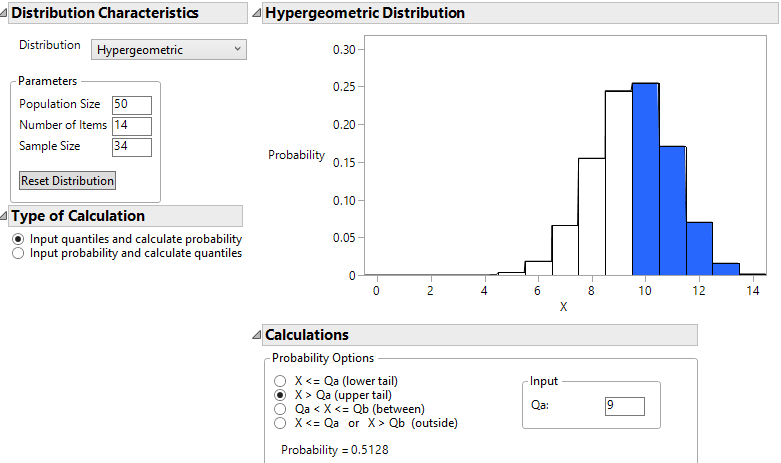
Interpretation: P(X ≥ 10), probability of 10 or more successes by random assignment alone (assuming no effect from the seed). If the yawn seed has no effect, the probability of finding 10 or more of 34 yawners in the seeded group when 50 subjects are randomly assigned to seeded and no-seed groups is 0.5128.
Using the hypergeometric probabilities to determine a p-value in this fashion for a two-way table is called Fisher’s Exact Test, named after R. A. Fisher.
Use technology to calculate hypergeometric probabilities (Fisher’s Exact Test) for two-way tables. You need to specify the total number of observations (\(N\)), the number of successes (\(M\)), and the sample size (\(n\)).
Set up and carry out the calculation to determine the exact p-value where you define the success to be "not yawning" and the group of interest to be the yawn seed group.
Set up and carry out the calculation to determine the exact p-value, where you focus on the number that did not yawn in the no-yawn-seed group. Show that you obtain the same exact p-value as before.
You should see that there are several equivalent ways to set up the probability calculation. Make sure it is clear how you define success/failure and which group you are considering "group A." This will help you determine the numerical values for \(N\text{,}\)\(M\text{,}\) and \(n\) in the calculation.
Using probability rules, you can show that the expected value of this distribution is \((14/50) \times 34 = 9.52\) yawners in yawn seed group and the standard deviation of the probability distribution is the square root of \(n \times (M/N) \times (N – M)/N \times (N – n)/(N – 1) = 1.496\) yawners.
On the MythBusters program, the hosts concluded that, based on the observed difference in conditional proportions and the large sample size, there is "little doubt, yawning seems to be contagious." Do you agree?
No! We are not able to discount "chance" (random assignment) as the explanation for the observed difference in the sample proportions. We should be cautious about generalizing beyond volunteers at a local flea market, as this was not a random sample from a broader population.
With a large p-value of 0.513 (Fisher’s Exact Test), we do not have any evidence that the difference between the two groups (with and without yawn seed) was created from something other than the random assignment process. If there was nothing to the theory that yawning is contagious, by "luck of the draw" alone, we would expect 10 or more of the yawners to end up in the yawn seed group in more than 50% of random assignments. Although the study results were in the conjectured direction, the difference between the yawning proportions was not large enough to convince us that the probability of yawning is truly larger when a yawn seed is planted. The researchers could try the study again with a larger sample size to increase the power of their test. The researchers also may want to be cautious in generalizing these results beyond the population of volunteers at a local flea market or how naturalistic the setting of leading individuals to a small room to wait is.
Checkpoint15.2.1Evidence Against Contagious Yawning.
For the MythBusters study (p-value > 0.5), is it reasonable to conclude from this study that we have strong evidence that yawning is not contagious? Explain.
Explain, in this context, what is meant in the Study Conclusions box by "the researchers could try the study again with a larger sample size to increase the power of their test" and why that is a reasonable recommendation here.
When the null hypothesis is true, the random variable \(X\) has a hypergeometric distribution. Specify the values of \(N\text{,}\)\(M\text{,}\) and \(n\text{.}\)
Calculate this exact p-value, either by hand or with technology. Comment on whether this p-value is similar to the approximate one from your simulation results. (Be sure it’s clear how you calculated this value.)
Suppose that the dolphin study had involved twice as many subjects, again with half randomly assigned to each group, and with the same proportion of improvers in each group. Determine the exact p-value in this case, and comment on whether/how it changes from the p-value with the real data. Explain why this makes sense.
Suppose I wanted to treat "not yawning" as a success. Consider \(Y\) = number of non-yawners in the yawn seed group. Show how to set up the hypergeometric calculation of
Use technology to calculate the probability of 24 or fewer non-yawners in the YawnSeed group using the hypergeometric distribution. (Include output.) How does this compare to the probability of 10 or more yawners in the YawnSeed group?
Suppose I want to find the probability of 4 or fewer yawners in the No Seed group. Identify the values of \(N\text{,}\)\(M\text{,}\)\(n\text{,}\) and \(k\text{.}\) Use technology to calculate the probability of 4 or fewer yawners in the No Seed group using the hypergeometric distribution. (Include readable output.)