Let
\(\pi\) represent the proportion of all American households with a cat (in spring 2024)
\(H_0: \pi = 1/3\) (population proportion equals one-third)
\(H_a: \pi \neq 1/3\) (differs from one-third)
Because the sample size is large and because the population size is large, I will use a z-test.
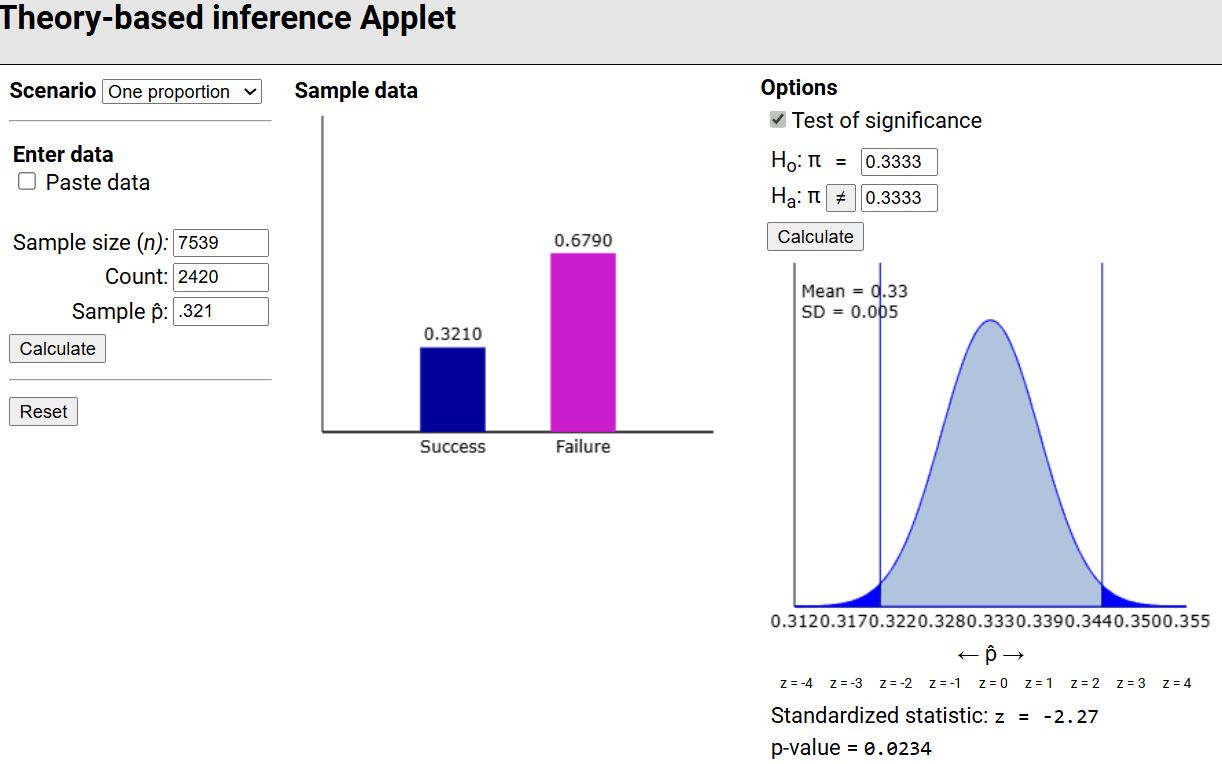
\(\hat{p} = 0.321\text{,}\) \(n = 7539\)
Standard error:
\(SE = \sqrt{\frac{(1/3)(2/3)}{7539}} \approx 0.00543\)
Test statistic:
\(z = \frac{0.321 - 0.3333}{0.00543} \approx -2.27\)
p-value:
\(\approx 0.0234\) (two-sided)
With a large standardized statistic and a small p-value, we will reject the null hypothesis and conclude that we have convincing evidence at the 0.05 level (0.0234 < 0.05) that the proportion of American households (in spring 2024) with a cat differed from 1/3.