Until 2021, the SAT exam in the United States included a hand-written essay. An article in the October 11, 2006 issue of the Washington Post found that among students who took the essay portion of the SAT exam in 2005-06, those who wrote in cursive style scored significantly higher on the essay, on average, than students who used printed block letters.
Would it be reasonable to conclude from this study that using cursive style causes students to score better on the essay? If so, explain why. If not, identify a potential confounding variable, and explain how it provides an alternative explanation for why the cursive writing group would have a significantly higher average essay score.
No, there are lots of potential confounding variables, such as the students’ educational background. Maybe students from private schools are more likely to use cursive and more likely to have taken SAT prep courses to score highly on the exam.
The article also mentioned a different study in which the same one essay was given to all graders. But some graders were shown a cursive version of the essay and the other graders were shown a version with printed block letters. The average score assigned to the essay with the cursive style was significantly higher than the average score assigned to the essay with the printed block letters.
Would the difference cited in Question 4 make it more reasonable to draw a cause-and-effect conclusion between writing style and SAT score with the second study than with the first one? Explain.
Definition: Observational Study vs. Experimental Study.
An observational study is one in which the researchers passively observe and record information about the observational units. In an experimental study, the researchers actively impose the explanatory variable (the categories are often called treatments) on the observational units (can also be called the experimental units in an experiment).
Because the researchers actively imposed which type of essay (the explanatory variable) each grader saw, rather than allowing the students to choose their own style of writing, the second study is considered an experiment, with the graders as the experimental units.
In designing an experiment, we want all conditions and variables between the treatment groups to be as similar as possible. Some conditions (e.g., time of day) can be controlled by the researchers, but some characteristics (e.g., handedness) cannot. Assigning all the right-handed graders to evaluate one style of writing and all of the left-handed graders to the other, would still create confounding and prevent us from drawing a cause-and-effect conclusion between the type of writing and the score, maybe left-handed graders tend to give higher grades??
In a well-designed experiment, experimental units are randomly assigned to the treatment groups. Each unit is equally likely to be assigned to any of the treatments.
To properly carry out such random assignment for say 24 graders, we could label each grader, say 01-24. Then use a random number generator to select 12 of the names. These 12 individuals could be assigned the block letter essay, and the rest the cursive essay.
The goal of the random assignment is to create groups that are as similar to each other as possible. To explore whether this actually does "work," we want to compare the groups that are created from random assignment. We will do this with the Randomizing Subjects applet.
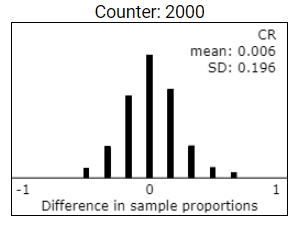
You will notice that the difference in the proportion right-handed is shown in the dotplot in the bottom graph. In this graph, one observation corresponds to one repetition of the random assignment, and the variable is the difference in proportions of right-handed graders between the two groups.
The dotplot will display the difference between the two proportions of right-handed graders for each of the 2,000 repetitions of the random assignment process.
What difference in proportion of right-handed graders did you find here? Did you ever get an absolute difference as large as 0.6667 (a 12/4 split)? Often or rarely? Which is more likely, ending up with a 12/4 split in right-handers or ending up with an 8/8 split in right-handers?
Is there a tendency for there to be a similar proportion of right-handed graders in the two groups? How are you deciding? What does this tell you about the plausibility of any later difference in the scores assigned by the two groups being attributed to right-handed graders being more stringent?
The tendency is for the proportions of right handers to be similar between the two groups (often equal, sometimes 1 or 2 more righties in one group compared to the other).
Having more right-handers than left-handers in the sample isn’t a problem, but a 12/4 split in right-handers between the treatment groups would be problematic, because then if the treatment group that had all right-handed graders showed lower scores, we wouldn’t know whether it was because of the writing style or something about right-handers. But with random assignment, such an unequal split is unlikely. Instead, the random assignment usually creates an 8/8 split or a 9/7 split. In this case, we will trust that the groups are balanced on the handedness variable and so handedness is not confounded with score.
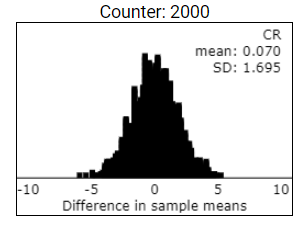
Correct! The center of the distribution of differences in average age is approximately zero, showing random assignment tends to balance age between groups.
No
Look at the center of the dotplot — the differences in average age should be centered around zero, indicating random assignment does tend to balance age.
Solution.
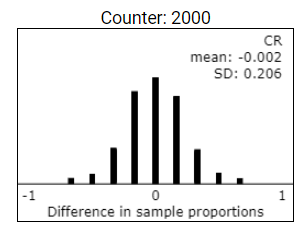
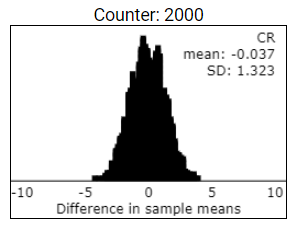
Yes, the center of this distribution is also approximately zero.
The applet shows you this school information for each subject and also the differences in the proportions of high school instructors in the two treatment groups.
Suppose there were other variables that might impact scoring accuracy that we might not even keep track of, like how much sleep the grader got the night before.
The primary goal of random assignment is to create groups that equalize any potential confounding variables between the groups, creating explanatory variable groups that overall differ only by the explanatory variable imposed. Note that this "balancing out" applies equally well to variables that can be observed (such as educational background and age) and variables that may not have been recorded (such as amount of sleep) or that cannot be observed in advance (such as when they will grade the essays). Although we could have forced variables like age and handedness to be equally distributed between the two groups, the virtue of random assignment is that it also tends to balance out variables that we might not have thought of before the start of the study and variables that we might not be able to see or control (e.g., eyesight). Thus, when we observe a "statistically significant" difference in the response variable between the two groups at the end of the study, we feel more comfortable attributing this difference to the explanatory variable (e.g., style of writing on the essay) because that should have been the only difference between the groups.
No, although how the individuals were recruited to the study does impact the "generalizability" of our results to a more diverse population, this is not a confounding variable because it does not differ between the two treatment groups.
The second study determined for each grader whether they would grade the exam written in block letters or in cursive letters. Because it was the same exam otherwise, there shouldn’t be any other reason for the difference in scores apart from the type of writing. For this reason, because the difference was statistically significant, you will soon see that we will be willing to conclude that the writing style caused the difference in scores. However, this only tells us about that one essay and in the slightly artificial condition of asking all the graders to grade the same essay. We don’t know whether the same effect would be found with other essays or conditions. By looking at the 2006 exams, we know that actual student papers were graded by actual graders, a more realistic setting, but also with the potential for confounding variables between the writing style and grade, such as student preparation prior to the exam.
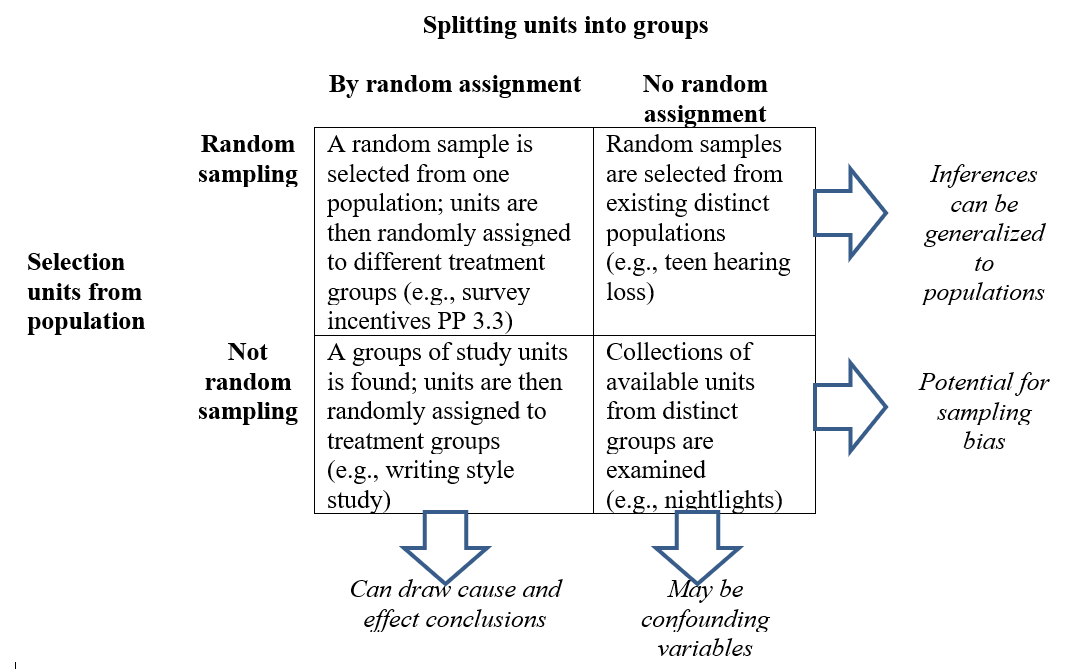
Keep in mind that cause-and-effect conclusions are a separate consideration from the generalizability of the results to a larger population. From now on we will consider each of these issues in our final conclusion as shown in the table below (adapted from Ramsey and Schafer’s The Statistical Sleuth):
A team of researchers (Singer et al., 2000) used the Survey of Consumer Attitudes to investigate whether incentives would improve the response rates on telephone surveys. A national sample of 735 households was randomly selected, and all 735 of the households were sent an "advance letter" explaining that the household would be contacted shortly for a telephone survey. However, 368 households were randomly assigned to receive a monetary incentive along with the advance letter, and the other 367 households were assigned to receive only the advance letter.
If these researchers find a statistically significant difference in the response rate between these two groups, would it be reasonable to draw a cause-and-effect conclusion? Explain (including any additional information you would need to know to decide).