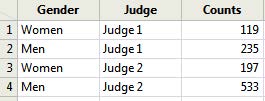
Summary of Chi-squared Tests.
Test of homogeneity: Data are independent random samples from \(I\) different populations/processes or from a randomized experiment with \(I\) treatments.
\(H_0\!: \pi_1 = \cdots = \pi_I\) where \(\pi_i\) is the probability of success for population (treatment) \(i\text{.}\)
\(H_a\!:\) at least one \(\pi_i\) differs from the rest.
OR
\(H_0\text{:}\) the response variable distributions are the same in each population (treatment).
\(H_a\text{:}\) at least one population (treatment) distribution differs from the others.
Test of association: Data are one random sample from a large population, cross-classified by two categorical variables.
\(H_0\!:\) no association between variable 1 and variable 2 in the population.
\(H_a\!:\) there is an association between variable 1 and variable 2.
Chi-square Statistic:
\begin{equation*}
\chi^2 = \sum_{i=1}^{r} \sum_{j=1}^{c} \frac{(Observed_{ij}-Expected_{ij})^2}{Expected_{ij}}
\end{equation*}
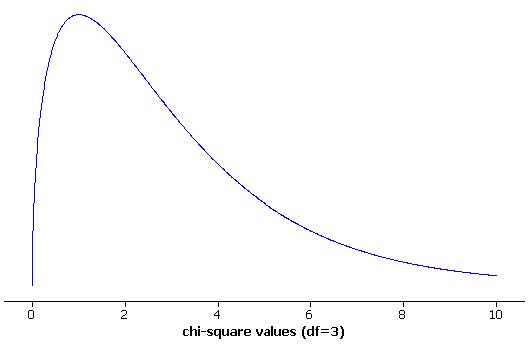
The (upper tail) p-value is calculated from the chi-square distribution with \({(r - 1)(c - 1)}\) degrees of freedom.
Technical conditions: at least 80% of expected counts are at least 5, and all expected counts are at least 1.
Follow-up analysis: After computing the p-value, examine the largest cell contributions or residuals to describe where observed counts differ most from expected counts.