
Section 25.3 Applet Exploration: Exploring ANOVA

Exercises Applet Exploration

You will now explore the effects of such factors as the size of the difference in the population means, the overall population standard deviations, and the sample sizes on the F-test statistic and p-value.
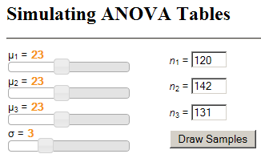
The sliders and text boxes should specify:
Simulating ANOVA Tables applet screenshot
  • Press the Draw Samples button. A sample will be selected from each population.
  • Press the Draw Samples button again.

2. Second Simulation Draw.

Did you obtain the same F-statistic and p-value? Why not?
Solution.
Results will vary from sample to sample by chance.
  • Press the Draw Samples button 10-20 more times, watching how the boxplots, F, and p-values change.

3. Many Draws Under Null.

Did you ever obtain a p-value below 0.05? Is this possible? Would it be surprising? Explain.
Solution.
It will be possible to obtain a p-value below .05, but should happen less than 5% of the time (by chance alone).
  • Change the value of \(\mu_1\) to 24. Press the Draw Samples button 10-20 times.

4. Increase One Mean.

Do the resulting p-values tend to be larger or smaller than in Question 3? Explain why this makes sense.
Solution.
Now all the p-values should be quite small. We should have more evidence against the null hypothesis in this case as it is indeed false.
  • Change each of the sample sizes to 20 and press Draw Samples 10-20 times.

5. Reduce Sample Sizes.

Do the resulting p-values tend to be larger or smaller than in Question 4? Explain why this makes sense.
Solution.
The p-values tend to be larger, there will be less evidence against the null hypothesis from the smaller sample sizes (more variability due to chance).
  • Press Draw Samples until you have a p-value less than 0.3. Now change the value of \(\sigma\) to 7.

6. Increase Population SD.

How does this affect the magnitude of the p-value? Explain why this relationship makes sense.
Solution.
Larger values of \(\sigma\) lead to larger p-values. This makes sense since larger values of \(\sigma\) correspond to more variability in the treatment groups, making it harder to detect differences between the groups.
  • Continue increasing \(\mu_1\)

7. Further Increase Mean Separation.

How does the p-value generally change if you now continue to increase the value of \(\mu_1\text{?}\) Explain why this relationship makes sense.
Solution.
The p-value will continue to get smaller since it will be easier to detect a difference when the size of the true difference is larger.

Discussion.

If the null hypothesis is true, then the p-value should vary uniformly between 0 and 1. In this case, the p-value will be less than 0.05 in 5% of all random samples, so 5% of samples would lead you to reject the null hypothesis even when it is true.
When the population means are further apart, the p-value is smaller. When the within-group variability is larger, the p-value is larger. When the sample sizes are larger and there is a difference among the population means, the p-value is smaller.
The p-value of any particular study is random, so we need to remember Type I and Type II errors. Committing a Type I error with analysis of variance indicates that we concluded the population means differ when they really do not differ. A Type II error indicates that we failed to conclude that at least one population mean differs when the population means are in actuality not all equal.
You have attempted of activities on this page.