The Pew Internet and American Life Project examines how Americans use the internet. In 2002 the organization took random samples of people from across the country and asked questions about their use of the internet. Consider the following information from this study:
| Northeast | South | Midwest | West | |
|---|---|---|---|---|
| Sample size | 3973 | 4332 | 4929 | 5137 |
| # of internet users | 2417 | 2372 | 2831 | 3259 |
Analyze these data to address the question of whether internet use varies across these four regions of the country. Include graphical and numerical summaries as well as a test of significance. Summarize your conclusions.
Solution.
We will treat the samples taken by the Pew organization as independent random samples from these four regions of the country. With a binary response variable (internet user or not) and more than two groups to compare, we will use a chi-squared analysis.
Let \(\pi_i\) represent the actual population proportion of internet users in region \(i\text{.}\) Then the hypotheses to be tested are:
\(H_0\text{:}\) \(\pi_{NE} = \pi_S = \pi_{MW} = \pi_W\)
(The population proportions of internet users are the same for all four regions.)
\(H_a\text{:}\) The population proportion of internet users is different in at least one region.
The two-way table of observed counts is:
| Northeast | South | Midwest | West | Total | |
|---|---|---|---|---|---|
| Internet users | 2417 | 2372 | 2831 | 3259 | 10,879 |
| Non-internet users | 1556 | 1960 | 2098 | 1878 | 7492 |
| Total | 3973 | 4332 | 4929 | 5137 | 18,371 |
The sample proportions of internet users in the four regions are:
| Northeast | South | Midwest | West | Total | |
|---|---|---|---|---|---|
| Proportion of internet users | .608 | .548 | .574 | .634 | .592 |
A segmented bar graph to display these data is:
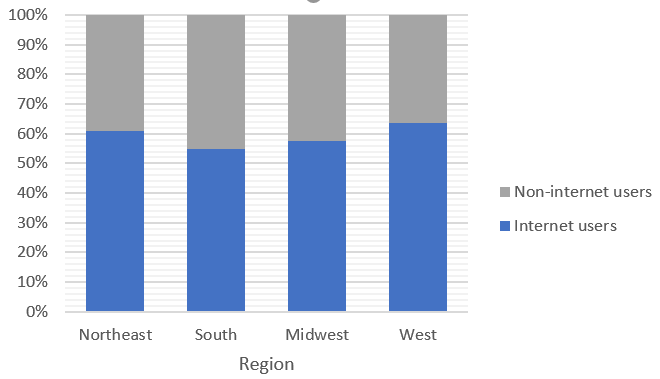
Segmented bar graph of internet users versus non-internet users by region; the internet-user proportion is about 61 percent in the Northeast, 55 percent in the South, 57 percent in the Midwest, and 63 percent in the West.
We notice that the proportions of internet users do not vary too much across these four regions. The west has the highest proportion, with about 63% internet use, and the south has the smallest with only 55% internet use.
To see whether at least one of these regions is statistically significantly different from the others, we use technology to determine the expected counts, chi-squared test statistic, and p-value. Below is software output:
R
> mydata = matrix(c(2417, 1556, 2372, 1960, 2831, 2098, 3259, 1878), ncol=4)
> chisq.test(mydata, correct=FALSE)

        Pearson's Chi-squared test

data:  mydata
X-squared = 84.46, df = 3, p-value < 2.2e-16
JMP
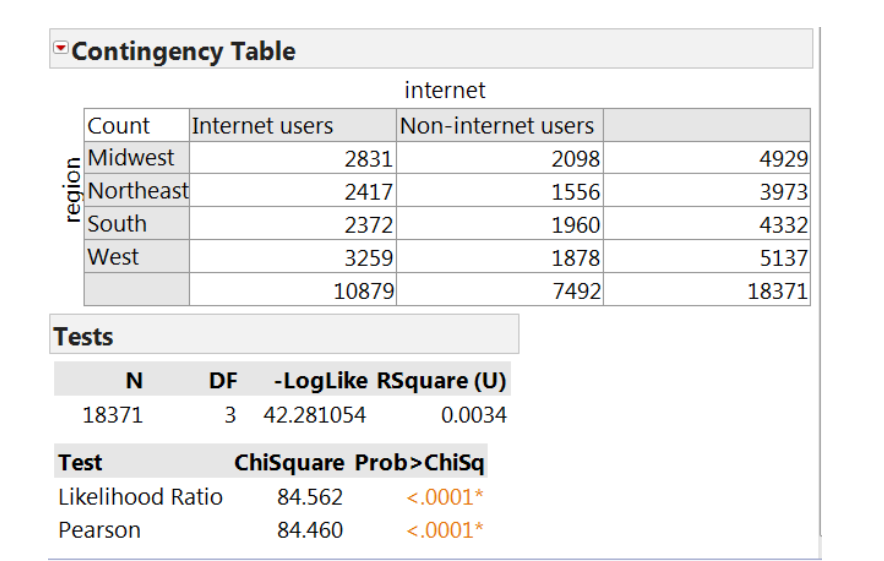
JMP Contingency Table of region by internet with counts for each cell and totals of 10879 internet users and 7492 non-internet users; the Tests panel shows N 18371, DF 3, and both Likelihood Ratio (84.562) and Pearson (84.460) chi-square statistics with probabilities less than .0001.
This procedure is valid because all of the expected counts are far larger than 5, and we are assuming that the Pew organization took independent random samples across the regions. Their report mentions that they used random digit dialing with extensive follow-up efforts, but it’s not clear whether they took independent samples within these regions or took a nationwide sample and treated region as one of the variables. Either way the chi-squared analysis is valid.
The p-value is extremely small (0.000 to three decimal places), indicating that the differences observed in the sample proportions would almost never occur by chance if the population proportions were really equal across the four regions. Thus, we have overwhelming evidence to reject the null hypothesis and conclude that the proportions of internet users are not the same in these four regions.
In an effort to say a little bit more, we can examine the cell contributions. We see that the largest contributions occur in the West and South. The West had more internet users, 3259, (and so fewer non-internet users) than would have been expected if the proportions were all the same, 3042.05, and the South had fewer internet users, 2372, (and so more non-users) than would have been expected, 2565.4. The observed counts in the Northeast and Midwest regions were fairly close to the expected counts.
In conclusion, the sample data provide very strong evidence that the population proportions of internet users differ across regions of the United States. The differences in the sample proportions are larger than can reasonably be explained by random sampling variation. The large sample sizes in this study help to render the differences among the samples statistically significant even though the sample proportions seem to be fairly similar in practical terms.

