How do researchers collect data? Why are the results of some studies more reliable than others? The way a researcher collects data depends upon the research goals. In this section, we look at different methods of collecting data and consider the types of conclusions that can be drawn from those methods.
Classify a study as observational or experimental, and determine when a study’s results can be generalized to the population and when a causal relationship can be drawn.
Each research question refers to a target population. In the first question, the target population is all swordfish in the Atlantic ocean, and each fish represents a case. Often times, it is too expensive to collect data for every case in a population. Instead, a sample is taken. A sample represents a subset of the cases and is often a small fraction of the population. For instance, 60 swordfish (or some other number) in the population might be selected, and this sample data may be used to provide an estimate of the population average and answer the research question.
For the second and third questions above, identify the target population and what represents an individual case. 1
Item 2 Notice that this question is only relevant to students who complete their degree; the average cannot be computed using a student who never finished her degree. Thus, only Duke undergrads who have graduated in the last five years are part of the population of interest. Each such student would represent an individual case. Item 3 A person with severe heart disease represents a case. The population includes all people with severe heart disease.
We collect a sample of data to better understand the characteristics of a population. A variable is a characteristic we measure for each individual or case. The overall quantity of interest may be the mean, median, proportion, or some other summary of a population. These population values are called parameters. We estimate the value of a parameter by taking a sample and computing a numerical summary called a statistic based on that sample. Note that the two p’s (population, parameter) go together and the two s’s (sample, statistic) go together.
Earlier we asked the question: what is the average mercury content in swordfish in the Atlantic Ocean? Identify the variable to be measured and the parameter and statistic of interest.
The variable is the level of mercury content in swordfish in the Atlantic Ocean. It will be measured for each individual swordfish. The parameter of interest is the average mercury content in all swordfish in the Atlantic Ocean. If we take a sample of 50 swordfish from the Atlantic Ocean, the average mercury content among just those 50 swordfish will be the statistic.
Two statistics we will study are the mean (also called the average) and proportion. When we are discussing a population, we label the mean as \(\mu\) (the Greek letter, mu), while we label the sample mean as \(\bar{x}\) (read as x-bar). When we are discussing a proportion in the context of a population, we use the label \(p\text{,}\) while the sample proportion has a label of \(\hat{p}\) (read as p-hat). Generally, we use \(\bar{x}\) to estimate the population mean, \(\mu\text{.}\) Likewise, we use the sample proportion \(\hat{p}\) to estimate the population proportion, \(p\text{.}\)
For the second question regarding time to complete a degree for a Duke undergraduate, is the variable numerical or categorical? What is the parameter of interest?
The characteristic that we record on each individual is the number of years until graduation, which is a numerical variable. The parameter of interest is the average time to degree for all Duke undergraduates, and we use \(\mu\) to describe this quantity.
The third question asked whether a new drug reduces deaths in patients with severe heart disease. Is the variable numerical or categorical? Describe the statistic that should be calculated in this study. 2
The variable is whether or not a patient with severe heart disease dies within the time frame of the study. This is categorical because it will be a yes or a no. The statistic that should be recorded is the proportion of patients that die within the time frame of the study, and we would use \(\hat{p}\) to denote this quantity.
Each conclusion is based on data. However, there are two problems. First, the data only represent one or two cases. Second, and more importantly, it is unclear whether these cases are actually representative of the population. Data collected in this haphazard fashion are called anecdotal evidence.
Figure1.3.6.In February 2010, some media pundits cited one large snow storm as valid evidence against global warming. As comedian Jon Stewart pointed out, “It’s one storm, in one region, of one country.” February 10th, 2010.
Be careful of making inferences based on anecdotal evidence. Such evidence may be true and verifiable, but it may only represent extraordinary cases. The majority of cases and the average case may in fact be very different.
Anecdotal evidence typically is composed of unusual cases that we recall based on their striking characteristics. For instance, we may vividly remember the time when our friend bought a lottery ticket and won $250 but forget most the times she bought one and lost. Instead of focusing on the most unusual cases, we should examine a representative sample of many cases.
When we ask questions about the relationship between two variables, we sometimes also want to determine if the change in one variable causes a change in the other. Consider the following rephrasing of an earlier question about the county data set:
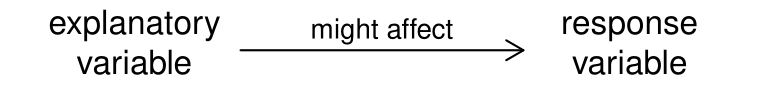
In this question, we are asking whether one variable affects another. If this is our underlying belief, then median household income is the explanatory variable and the population change is the response variable in the hypothesized relationship. 3
Sometimes the explanatory variable is called the independent variable and the response variable is called the dependent variable. However, this becomes confusing since a pair of variables might be independent or dependent, so we avoid this language.
Labeling variables as explanatory and response does not guarantee the relationship between the two is actually causal, even if there is an association identified between the two variables. We use these labels only to keep track of which variable we suspect affects the other.
In many cases, the relationship is complex or unknown. It may be unclear whether variable \(A\) explains variable \(B\) or whether variable \(B\) explains variable \(A\text{.}\) For example, it is now known that a particular protein called REST is much depleted in people suffering from Alzheimer’s disease. While this raises hopes of a possible approach for treating Alzheimer’s, it is still unknown whether the lack of the protein causes brain deterioration, whether brain deterioration causes depletion in the REST protein, or whether some third variable causes both brain deterioration and REST depletion. That is, we do not know if the lack of the protein is an explanatory variable or a response variable. Perhaps it is both. 4
Researchers perform an observational study when they collect data without interfering with how the data arise. For instance, researchers may collect information via surveys, review medical or company records, or follow a cohort of many similar individuals to study why certain diseases might develop. In each of these situations, researchers merely observe or take measurements of things that arise naturally.
When researchers want to investigate the possibility of a causal connection, they conduct an experiment. For all experiments, the researchers must impose a treatment. For most studies there will be both an explanatory and a response variable. For instance, we may suspect administering a drug will reduce mortality in heart attack patients over the following year. To check if there really is a causal connection between the explanatory variable and the response, researchers will collect a sample of individuals and split them into groups. The individuals in each group are assigned a treatment. When individuals are randomly assigned to a group, the experiment is called a randomized experiment. For example, each heart attack patient in the drug trial could be randomly assigned into one of two groups: the first group receives a placebo (fake treatment) and the second group receives the drug. See the case study in Section 1.1 for another example of an experiment, though that study did not employ a placebo.
Suppose that a researcher is interested in the average tip customers at a particular restaurant give. Should she carry out an observational study or an experiment?
In addressing this question, we ask, “Will the researcher be imposing any treatment?” Because there is no treatment or interference that would be applicable here, it will be an observational study. Additionally, one consideration the researcher should be aware of is that, if customers know their tips are being recorded, it could change their behavior, making the results of the study inaccurate.
The population is the entire group that the researchers are interested in. Because it is usually too costly to gather the data for the entire population, researchers will collect data from a sample, representing a subset of the population.
A parameter is a true quantity for the entire population, while a statistic is what is calculated from the sample. A parameter is about a population and a statistic is about a sample. Remember: p goes with p and s goes with s.
There are two primary types of data collection: observational studies and experiments. In an experiment, researchers impose a treatment to look for a causal relationship between the treatment and the response. In an observational study, researchers simply collect data without imposing any treatment.
Remember: Correlation is not causation! In other words, an association between two variables does not imply that one causes the other. Proving a causal relationship requires a well-designed experiment.
1.Air pollution and birth outcomes, scope of inference.
Exercise 1.2.5.1 introduces a study where researchers collected data to examine the relationship between air pollutants and preterm births in Southern California. During the study air pollution levels were measured by air quality monitoring stations. Length of gestation data were collected on 143,196 births between the years 1989 and 1993, and air pollution exposure during gestation was calculated for each birth.
Identify the population of interest and the sample in this study.
Comment on whether or not the results of the study can be generalized to the population, and if the findings of the study can be used to establish causal relationships.
If births in this time span at the geography can be considered to be representative of all births, then the results are generalizable to the population of Southern California. However, since the study is observational the findings cannot be used to establish causal relationships.
Exercise 1.2.5.3 introduces a study where researchers studying the relationship between honesty, age, and self-control conducted an experiment on 160 children between the ages of 5 and 15. The researchers asked each child to toss a fair coin in private and to record the outcome (white or black) on a paper sheet, and said they would only reward children who report white. Half the students were explicitly told not to cheat and the others were not given any explicit instructions. Differences were observed in the cheating rates in the instruction and no instruction groups, as well as some differences across children’s characteristics within each group.
Identify the population of interest and the sample in this study.
Comment on whether or not the results of the study can be generalized to the population, and if the findings of the study can be used to establish causal relationships.
Exercise 1.2.5.2 introduces a study on using the Buteyko shallow breathing technique to reduce asthma symptoms and improve quality of life. As part of this study 600 asthma patients aged 18-69 who relied on medication for asthma treatment were recruited and randomly assigned to two groups: one practiced the Buteyko method and the other did not. Those in the Buteyko group experienced, on average, a significant reduction in asthma symptoms and an improvement in quality of life.
Identify the population of interest and the sample in this study.
Comment on whether or not the results of the study can be generalized to the population, and if the findings of the study can be used to establish causal relationships.
If the patients in this sample, who are likely not randomly sampled, can be considered to be representative of all asthma patients aged 18-69 who rely on medication for asthma treatment, then the results are generalizable to the population defined above. Additionally, since the study is experimental, the findings can be used to establish causal relationships.
Exercise 1.2.5.4 introduces a study on the relationship between socio-economic class and unethical behavior. As part of this study 129 University of California Berkeley undergraduates were asked to identify themselves as having low or high social-class by comparing themselves to others with the most (least) money, most (least) education, and most (least) respected jobs. They were also presented with a jar of individually wrapped candies and informed that the candies were for children in a nearby laboratory, but that they could take some if they wanted. After completing some unrelated tasks, participants reported the number of candies they had taken. It was found that those who were identified as upper-class took more candy than others.
Identify the population of interest and the sample in this study.
Comment on whether or not the results of the study can be generalized to the population, and if the findings of the study can be used to establish causal relationships.
The General Social Survey asked the question, “After an average work day, about how many hours do you have to relax or pursue activities that you enjoy?” to a random sample of 1,155 Americans. The average relaxing time was found to be 1.65 hours. Determine which of the following is an observation, a variable, a sample statistic (value calculated based on the observed sample), or a population parameter.
Suppose you want to estimate the percentage of videos on YouTube that are cat videos. It is impossible for you to watch all videos on YouTube so you use a random video picker to select 1000 videos for you. You find that 2% of these videos are cat videos.Determine which of the following is an observation, a variable, a sample statistic (value calculated based on the observed sample), or a population parameter.
Percentage of all videos on YouTube that are cat videos.