Identify: We will test the following hypotheses at the
\(\alpha=0.05\) significance level.
\(H_0\text{:}\) The distribution of M&M colors is the same as the stated distribution in 2008.
\(H_A\text{:}\) The distribution of M&M colors is different than the stated distribution in 2008.
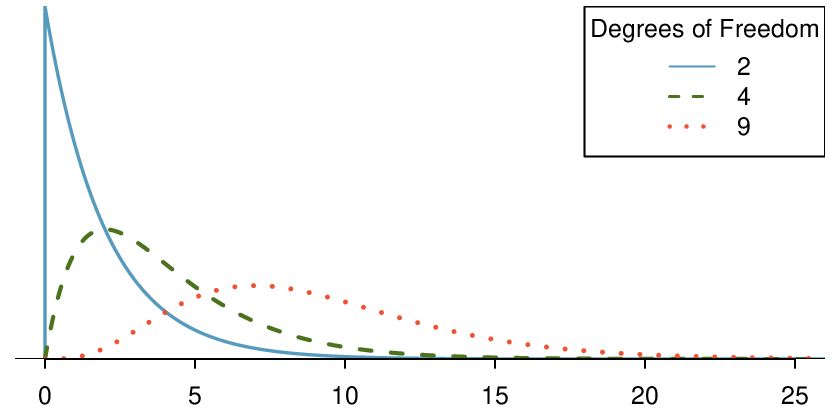
Choose: Because we have one variable (color), broken up into multiple categories, we choose the chi-square goodness of fit test.
Check: We must verify that the test statistic follows a chi-square distribution. Note that there is only one sample here. The website percentages are considered fixed — they are not the result of a sample and do not have sampling variability associated with them. To carry out the chi-square goodness of fit test, we will have to assume that Wicklin’s sample can be considered a random sample of M&M’s. We note that the total population size of M&M’s is much larger than 10 times the sample size of 712. Next, we need to find the expected counts. Here,
\(n=712\text{.}\) If
\(H_0\) is true, then we would expect 24% of the M&M’s to be Blue, 20% to be Orange, etc. So the expected counts can be found as:
|
|
|
|
|
|
|
|
|
|
Blue |
Orange |
Green |
Yellow |
Red |
Brown |
| expected counts: |
|
0.24(712) |
0.20(712) |
0.16(712) |
0.14(712) |
0.13(712) |
0.13(712) |
|
|
= 170.9 |
= 142.4 |
= 113.9 |
= 99.6 |
= 92.6 |
= 92.6 |
Calculate: We will calculate the chi-square statistic, degrees of freedom, and the p-value.
To calculate the chi-square statistic, we need the observed counts as well as the expected counts. To find the observed counts, we use the observed percentages. For example, 18.7% of
\(712 = 0.187(712)=133\text{.}\)
|
|
|
|
|
|
|
|
|
|
Blue |
Orange |
Green |
Yellow |
Red |
Brown |
| observed counts: |
|
133 |
133 |
139 |
103 |
108 |
96 |
| expected counts: |
|
170.9 |
142.4 |
113.9 |
99.6 |
92.6 |
92.6 |
\begin{align*}
\chi^2
=\amp \sum{\frac{\text{ (observed } - \text{ expected } )^2}
{\text{ expected } }}\\
=\amp \frac{(133 - 170.9)^2}{170.9}
+ \frac{(133 - 142.4)^2}{142.4}
+ \cdots
+ \frac{(108 - 92.6)^2}{92.6}
+ \frac{(96 - 92.6)^2}{92.6}\\
=\amp 8.41+0.62+5.53+0.12+2.56+0.12\\
=\amp 17.36
\end{align*}
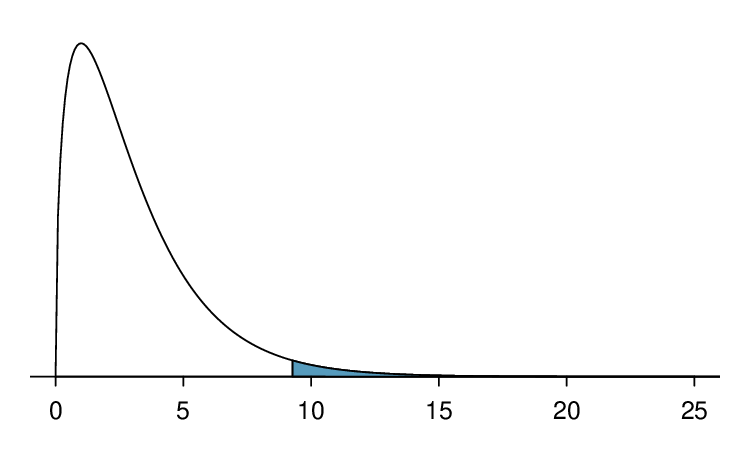
Because there are six colors, the degrees of freedom is
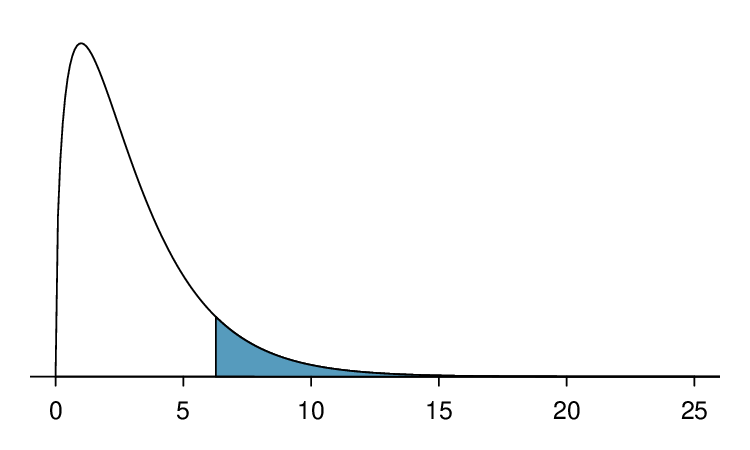
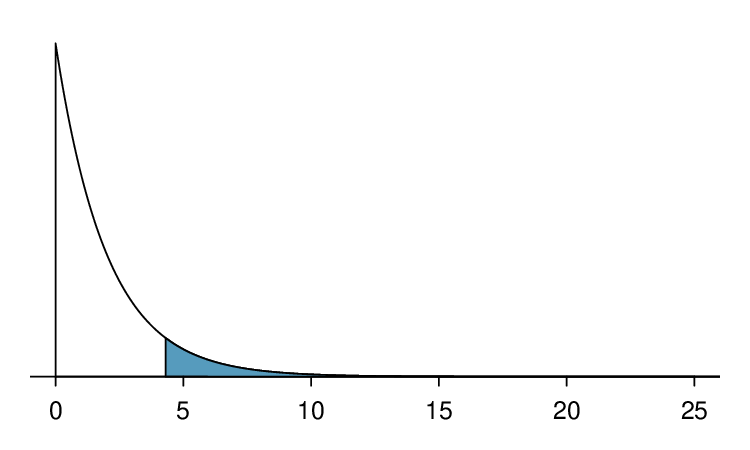
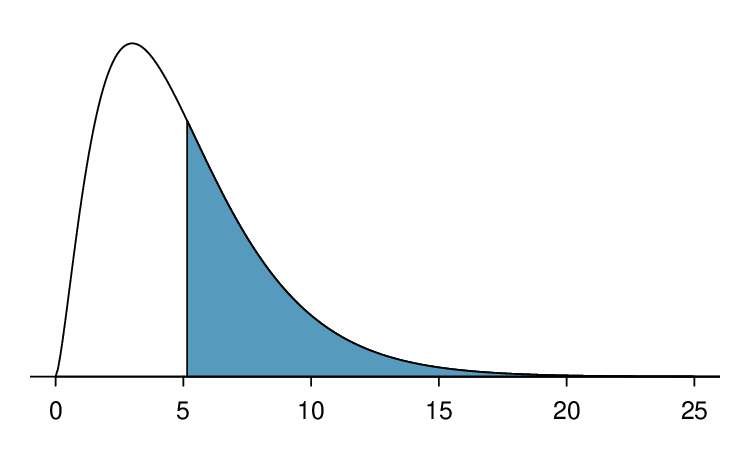
\(6-1=5\text{.}\) In a chi-square test, the p-value is always the area to the
right of the chi-square statistic. Here, the area to the right of 17.36 under the chi-square curve with 5 degrees of freedom is
\(0.004\text{.}\)
Conclude: The p-value of 0.004 is
\(\lt 0.05\text{,}\) so we reject
\(H_0\text{;}\) there is sufficient evidence that the distribution of M&M’s does not match the stated distribution on the website in 2008.