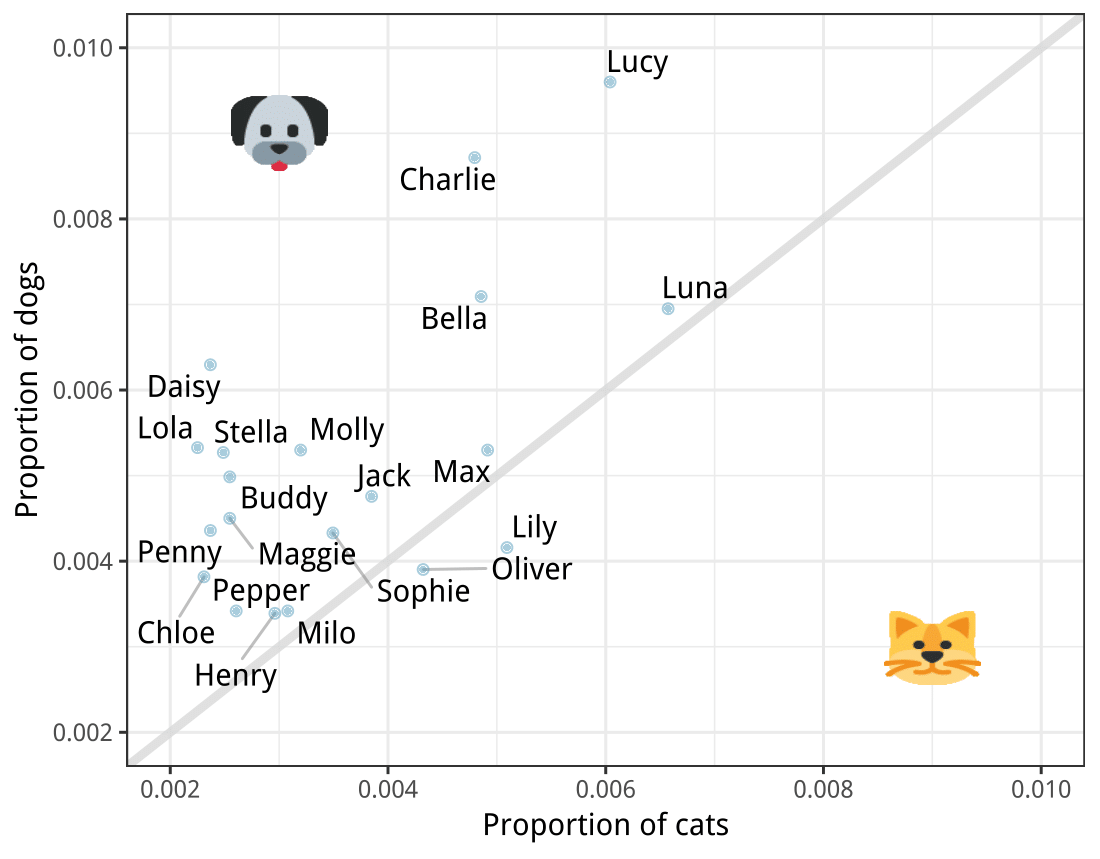
The city of Seattle, WA has an open data portal that includes pets registered in the city. For each registered pet, we have information on the pet’s name and species. The following visualization plots the proportion of dogs with a given name versus the proportion of cats with the same name. The 20 most common cat and dog names are displayed. The diagonal line on the plot is the \(x = y\) line; if a name appeared on this line, the name’s popularity would be exactly the same for dogs and cats.
In a study evaluating the relationship between stress and muscle cramps, half the subjects are randomly assigned to be exposed to increased stress by being placed into an elevator that falls rapidly and stops abruptly and the other half are left at no or baseline stress.
Chia Pets -- those terra-cotta figurines that sprout fuzzy green hair -- made the chia plant a household name. But chia has gained an entirely new reputation as a diet supplement. In one 2009 study, a team of researchers recruited 38 men and divided them randomly into two groups: treatment or control. They also recruited 38 women, and they randomly placed half of these participants into the treatment group and the other half into the control group. One group was given 25 grams of chia seeds twice a day, and the other was given a placebo. The subjects volunteered to be a part of the study. After 12 weeks, the scientists found no significant difference between the groups in appetite or weight loss. 1
Since this is an experiment, we can make a causal statement. However, since the sample is not random, the causal statement cannot be generalized to the population at large.
A city council has requested a household survey be conducted in a suburban area of their city. The area is broken into many distinct and unique neighborhoods, some including large homes, some with only apartments, and others a diverse mixture of housing structures. For each part below, identify the sampling methods described, and describe the statistical pros and cons of the method in the city’s context.
Identify the flaw(s) in reasoning in the following scenarios. Explain what the individuals in the study should have done differently if they wanted to make such strong conclusions.
Students at an elementary school are given a questionnaire that they are asked to return after their parents have completed it. One of the questions asked is, “Do you find that your work schedule makes it difficult for you to spend time with your kids after school?” Of the parents who replied, 85% said “no”. Based on these results, the school officials conclude that a great majority of the parents have no difficulty spending time with their kids after school.
A survey is conducted on a simple random sample of 1,000 women who recently gave birth, asking them about whether or not they smoked during pregnancy. A follow-up survey asking if the children have respiratory problems is conducted 3 years later, however, only 567 of these women are reached at the same address. The researcher reports that these 567 women are representative of all mothers.
An orthopedist administers a questionnaire to 30 of his patients who do not have any joint problems and finds that 20 of them regularly go running. He concludes that running decreases the risk of joint problems.
Non-responders may have a different response to this question, e.g. parents who returned the surveys likely don’t have difficulty spending time with their children.
It is unlikely that the women who were reached at the same address 3 years later are a random sample. These missing responders are probably renters (as opposed to homeowners) which means that they might be in a lower socio-economic status than the respondents.
There is no control group in this study, this is an observational study, and there may be confounding variables, e.g. these people may go running because they are generally healthier and/or do other exercises.
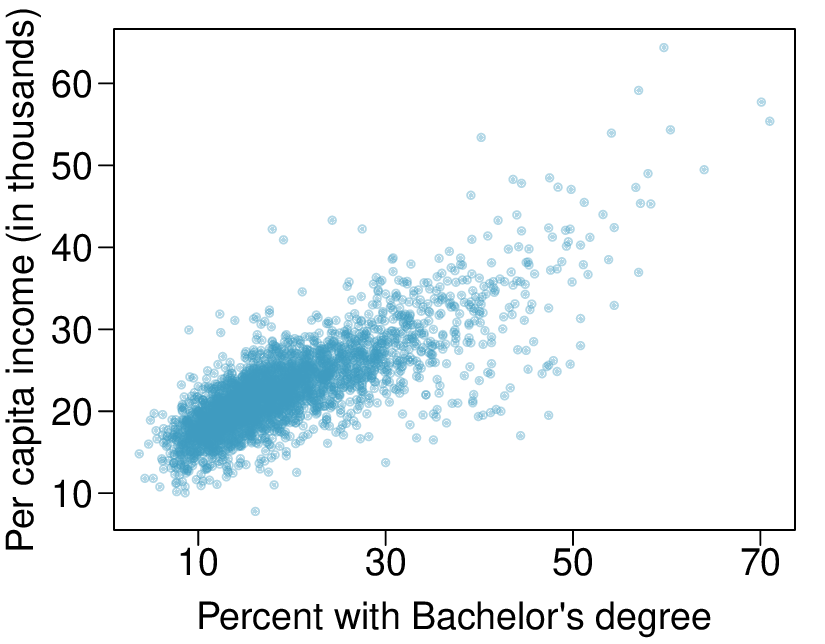
The scatterplot below shows the relationship between per capita income (in thousands of dollars) and percent of population with a bachelor’s degree in 3,143 in the US in 2010.
In a public health study on the effects of consumption of fruits and vegetables on psychological well-being in young adults, participants were randomly assigned to three groups: (1) diet-as-usual, (2) an ecological momentary intervention involving text message reminders to increase their fruits and vegetable consumption plus a voucher to purchase them, or (3) a fruit and vegetable intervention in which participants were given two additional daily servings of fresh fruits and vegetables to consume on top of their normal diet. Participants were asked to take a nightly survey on their smartphones. Participants were student volunteers at the University of Otago, New Zealand. At the end of the 14-day study, only participants in the third group showed improvements to their psychological well-being acrossthe 14-days relative to the other groups. 2
Tamlin S Conner et al. “Let them eat fruit! The effect of fruit and vegetable consumption on psychological well-being in young adults: A randomized controlled trial”. In: PloS one 12.2 (2017), e0171206.
A newspaper article reporting on the study states, “The results of this study provide proof that giving young adults fresh fruits and vegetables to eat can have psychological benefits, even over a brief period of time.” How would you suggest revising this statement so that it can be supported by the study?
In a study of three nationally representative large-scale data sets from Ireland, the United States, and the United Kingdom (\(n = 17,247\)), teenagers between the ages of 12 to 15 were asked to keep a diary of their screen time and answer questions about how they felt or acted. The answers to these questions were then used to compute a psychological well-being score. Additional data were collected and included in the analysis, such as each child’s sex and age, and on the mother’s education, ethnicity, psychological distress, and employment. The study concluded that there is little clear-cut evidence that screen time decreases adolescent well-being. 3
The Stanford Open Policing project gathers, analyzes, and releases records from traffic stops by law enforcement agencies across the United States. Their goal is to help researchers, journalists, and policymakers investigate and improve interactions between police and thepublic. 4
State whether each variable is numerical or categorical. If numerical, state whether it is continuous or discrete. If categorical, state whether it is ordinal or not.
Suppose we wanted to evaluate whether vehicle search rates are different for drivers of different races. In this analysis, which variable would be the response variable and which variable would be the explanatory variable?
The following summary table shows the number of space launches in the US by the type of launching agency and the outcome of the launch (success or failure). 5
State whether each variable is numerical or categorical. If numerical, state whether it is continuous or discrete. If categorical, state whether it is ordinal or not.
Suppose we wanted to study how the success rate of launches vary between launching agencies and over time. In this analysis, which variable would be the response variable and which variable would be the explanatory variable?