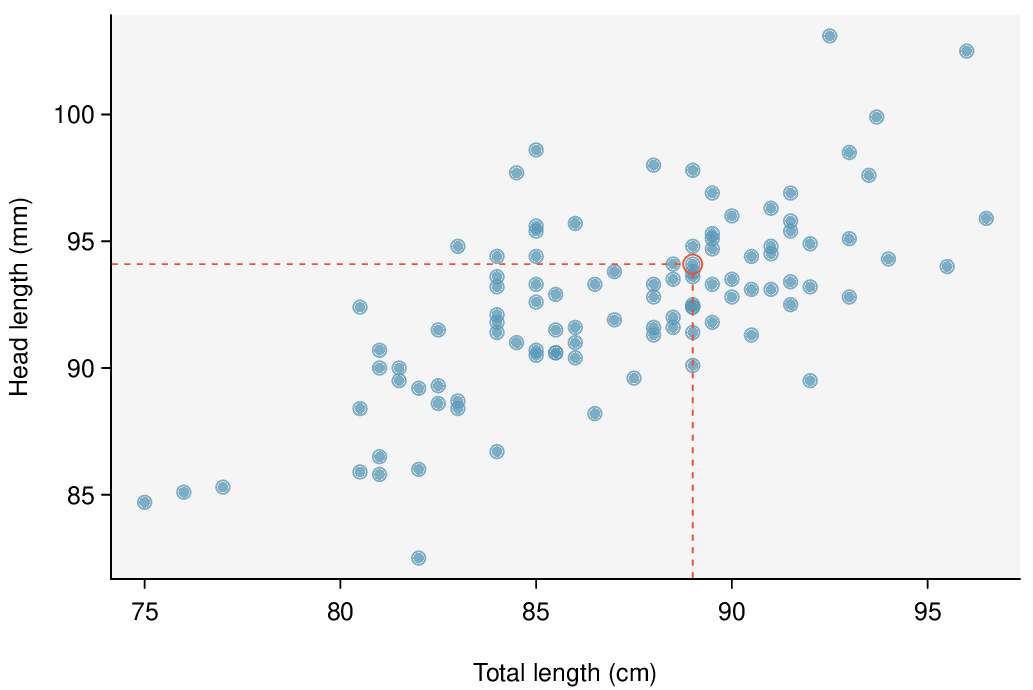
Here, changing the units of
\(y\) corresponds to multiplying all the
\(y\) values by a certain number. This would change the mean and the standard deviation of
\(y\text{,}\) but it would not change the correlation. To see this, imagine dividing every number on the vertical axis by 10. The units of
\(y\) are now in cm rather than in mm, but the graph has remain exactly the same. The units of
\(y\) have changed, by the relative distance of the
\(y\) values about the mean are the same; that is, the Z-scores corresponding to the
\(y\) values have remained the same.