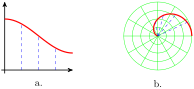
When we plot points in Cartesian coordinates, we start at the origin and move a distance right or left given by the \(x\)-coordinate of the point, then move up or down according to the \(y\)-coordinate. When we sketch the graph of an equation or function, we think of drawing the graph from left to right, with the "height" of the graph at each \(x\)-value given by the function, as shown in figure (a).
In polar coordinates, however, the dependent variable, \(r\text{,}\) gives not a height but a distance from the pole in direction \(\theta\text{,}\) as shown in figure (b). When graphing an equation in polar coordinates, we think of sweeping around the pole in the counterclockwise direction, and at each angle \(\theta\) the \(r\)-value tells us how far the graph is from the pole.
We make a table of values, choosing the special values for \(\theta\text{.}\) For each value of \(\theta\text{,}\) we evaluate \(r=2\sin (\theta)\text{.}\)
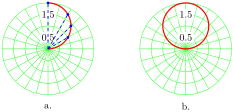
First we’ll plot the points in the first quadrant. Observe that as \(\theta\) increases from \(0\) to \(\dfrac{\pi}{2}\text{,}\)\(r\) increases from \(0\) to \(2\text{.}\) Starting at the pole, we connect the points in order of increasing \(\theta\text{.}\) Imagine a radial line sweeping around the graph through the first quadrant: as the angle increases, the length of the segment increases, so that its tip traces out the graph shown in figure (a).
Now continue plotting the points in the table as \(\theta\) increases from \(\dfrac{\pi}{2}\) to \(\pi\text{.}\) In the second quadrant, \(r\) decreases as \(\theta\) increases, as shown in figure (b). The graph we obtain is, in fact, a circle, which we will prove algebraically shortly. However, we have not yet plotted points for \(\theta\) between \(0\) and \(2\pi\text{.}\) Because \(\sin (\theta)\) is negative in the third and fourth quadrants, all the \(r\)-values for these angles are negative.
When we plot the points in this table, we see that the original graph is traced out again. For example, the point \(\left(\dfrac{7\pi}{6}, -1\right)\) is the same as the point \(\left(\dfrac{\pi}{6}, 1\right)\text{,}\) the point \(\left(\dfrac{5\pi}{4}, -\sqrt{2}\right)\) is the same as the point \(\left(\dfrac{\pi}{4}, \sqrt{2}\right)\text{,}\) and so on, around the circle. Thus, the graph of \(r=2\sin \theta\) is a circle, traced twice for \(0 \le \theta \le 2\pi\text{.}\)
To prove that the graph in the previous Example is really a circle, we convert the equation \(~r=2\sin (\theta)~\) to Cartesian form. First, multiply both sides by \(r\) to obtain
Next, replace \(r^2\) by \(x^2+y^2\) and \(r\sin (\theta)\) by \(y\text{,}\) to get
\begin{equation*}
x^2+y^2 = 2y
\end{equation*}
This equation is quadratic in two variables, so its graph is a conic section. We put the equation in standard form by completing the square in \(y\text{.}\)
\begin{align*}
x^2+y^2 - 2y \amp = 0 \amp \amp \blert{\text{Add 1 to both sides.}}\\
x^2+(y^2-2y ~\alert{+1}) \amp =\alert{1} \amp \amp \blert{\text{Write the equation in standard form.}}\\
(x-0)^2 + (y-1)^2 \amp = 1
\end{align*}
We have the equation of a circle with center \((0,1)\) and radius \(1\text{.}\)
You are familiar with the graphs of many equations in Cartesian coordinates, including lines, parabolas and other conic sections, and the graphs of basic functions. You should now become familiar with some standard graphs in polar coordinates. These include circles and roses, cardioids and limaçons, lemniscates, and spirals.
At the end of this section you will find a Catalog of the basic polar graphs and their properties. You can use your calculator, set in Polar mode, to experiment with these graphs.
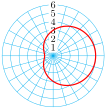
As \(\theta\) increases, \(r\) increases also, at a constant rate. We wind our way around the pole, steadily increasing our distance from the pole as we go. We spiral outwards, tracing the graph shown above.
Observe that, as \(\theta\) increases from \(0\) to \(\dfrac{\pi}{3}\text{,}\)\(r\) first increases, reaching its maximum value of 2 at \(\theta = \dfrac{\pi}{6}\) and then decreases back to 0. You can verify the values in the table below, which shows the points at multiples of \(\dfrac{\pi}{18}\text{.}\) These points create the first loop of the graph.
Next, change \(\theta\text{max}\) to \(\dfrac{2\pi}{3}\text{,}\) and graph again. This time the calculator traces out two loops, as shown in figure (b). For \(\theta\) between \(\dfrac{\pi}{3}\) and \(\dfrac{2\pi}{3}\text{,}\)\(r\) is negative, so the second loop lies in the third and fourth quadrants.
Finally, change \(\theta\text{max}\) to \(\pi\text{,}\) and graph again. For \(\theta\) between \(\dfrac{2\pi}{3}\) and \(\pi\text{,}\) the graph traces out a third loop, as shown in figure (c). For \(\theta\) between \(\pi\) and \(2\pi\text{,}\) the entire graph is traced a second time. The finished graph is a rose with 3 petals of length 2.
You should also be able to sketch the standard polar graphs by hand. Once you recognize an equation as a particular type of graph, say a rose or a limaçon, you can sketch the graph quickly by finding just a few well-chosen guidepoints. The next example demonstrates a technique for sketching a rose.
Referring to the Catalog of Polar Graphs, we see that the graph of this equation is a rose, with petal length \(a=3\) and four petals, because \(2n=4\text{.}\) If we can locate the tips of the petals, we can use them as guidepoints to sketch the graph.
Now, the points at the tips of the petals have \(r=3\text{,}\) so we substitute \(r=3\) into the equation of the rose to find the values of \(\theta\) at those points.
\begin{align*}
3 \amp = 3\sin (2\theta) \amp\amp \blert{\text{Divide both sides by } 3.}\\
1 \amp = \sin (2\theta) \amp\amp \blert{\text{Apply the arcsine function to both sides.}}\\
\dfrac{\pi}{2} \amp = 2\theta \amp\amp \blert{\text{Divide both sides by } 2.}\\
\dfrac{\pi}{4} \amp = \theta
\end{align*}
Thus, one of the petal tips is located at \(\theta = \dfrac{\pi}{4}\text{.}\) Because the 4 petals are evenly spaced around the pole, the angle between the petals is \(\dfrac{2\pi}{4} = \dfrac{\pi}{2}\text{,}\) and the other petal tips occur at
We plot the tips of the petals as guidepoints, at \(\left(3, \dfrac{\pi}{4}\right)\text{,}\)\(~ \left(3, \dfrac{3\pi}{4}\right)\text{,}\)\(~ \left(3, \dfrac{5\pi}{4}\right)\)and \(\left(3, \dfrac{7\pi}{4}\right)\text{.}\) Now we can sketch a rose with 4 petals of length 3, as shown at right.
The limaçons, \(~r=a\pm\sin (\theta)~\) and \(~r=a\pm\cos (\theta)~\text{,}\) are another family of polar graphs. In particular, the cardioid is a special case of a limaçon with \(a=b\text{.}\)
This is the equation for a limaçon, with \(a=3\) and \(b=2\text{.}\) Because \(a \gt b\text{,}\) the limaçon will have a dent, like a lima bean, rather than a loop. As guidepoints, we locate the points at the four quadrantal angles.
We plot the guidepoints and connect them in order with a smooth curve, as shown above. Note that this limaçon involving cosine is symmetric about the \(x\)-axis; limaçons involving sine are symmetric about the \(y\)-axis.
The graph is a circle centered at \((-2,0)\) and with radius 2, so we choose the equation \(~r=2a\cos (\theta)\text{,}\) with \(a=-2\text{.}\) Thus, \(~r=-4\cos (\theta)\text{.}\)
The graph is a cardioid with its axis of symmetry on the \(x\)-axis, and the "bottom" of the heart points in the positive\(x\)direction, so its equation has the form \(~r=a+a\cos (\theta)\text{.}\) At \(\theta=0,~ r=2\text{,}\) so we can solve for \(a\text{:}\)
\begin{align*}
2 \amp = a + a\cos (0)\\
2 \amp = a + a(1) =2a
\end{align*}
Thus, \(a=1\) and we choose the equation \(~r=1+\cos (\theta)\text{.}\)
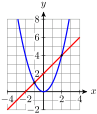
To find the intersection points of two graphs, we solve the system made up of their equations. If the equations are \(y=f(x)\) and \(y=g(x)\text{,}\) we simply solve the equation \(f(x)=g(x)\text{.}\) For example, we find the intersection points of \(~y=x^2~\) and \(~y=x+2~\) by solving the equation \(x^2-x-2=0\) to get
However, you can see in the figure that the graphs also appear to intersect at the pole. To verify that the pole indeed lies on both graphs, we can solve for \(\theta\) in each equation when \(r=\alert{0}\text{.}\)
Both points, \(\left(0,\dfrac{3\pi}{2}\right)\) and \((0,\pi)\text{,}\) represent the pole. Thus, the graphs intersect at three points: \(\left(2 + \sqrt{2}, \dfrac{\pi}{4}\right)\text{,}\)\(\left(2 - \sqrt{2}, \dfrac{5\pi}{4}\right)\text{,}\) and the pole.
As we saw in the previous Example, solving a system of equations \(~r=f(\theta)~\) and \(~r=g(\theta)~\) will not always reveal an intersection at the pole, because \(r\) may be equal to zero for different values of \(\theta\) in the two equations.
In fact, every point has multiple representation in polar coordinates, for example \((r,\theta)\) and \((-r,\pi+\theta)\text{.}\) Solving the system of equations \(~r=f(\theta)~\) and \(~r=g(\theta)~\) could miss intersection points besides the pole. We should check the graphs to identify how many points of intersection there are.
When graphing an equation in polar coordinates, we think of sweeping around the pole in the counterclockwise direction, and at each angle \(\theta\) the \(r\)-value tells us how far the graph is from the pole.
To find the intersection points of the polar graphs \(r=f(\theta)\) and \(r=g(\theta)\) we solve the equation \(f(\theta)=g(\theta)\text{.}\) In addition, we should always check whether the pole is a point on both graphs.
Delbert says that the graph of \(r=2\sin (\theta)\) in the first example cannot be correct, because there are no points on the graph for angles between \(\pi\)and \(2\pi\text{.}\) How do you respond?
Graph \(\theta=k\text{,}\) for \(k=\dfrac{\pi}{6},~ \dfrac{\pi}{3},~\dfrac{2\pi}{3},~\dfrac{5\pi}{6}\text{.}\) How does the graph change for different values of \(k\text{?}\)
Graph \(\theta=k\text{,}\) for \(k=\dfrac{7\pi}{6},~ \dfrac{4\pi}{3},~\dfrac{5\pi}{3},~\dfrac{11\pi}{6}\text{.}\) How does the graph change for different values of \(k\text{?}\)
Graph the circle \(r=4\cos (\theta)\text{.}\) Label the points corresponding to \(\theta = 0,~\dfrac{\pi}{4},~\dfrac{\pi}{2},~\dfrac{3\pi}{4},\) and \(\pi\text{.}\)
Graph the circle \(r=4\sin (\theta)\text{.}\) Label the points corresponding to \(\theta = 0,~\dfrac{\pi}{4},~\dfrac{\pi}{2},~\dfrac{3\pi}{4},\) and \(\pi\text{.}\)
For Problems 25–42, use the catalog of polar graphs to help you identify and sketch the following curves. Check your work by graphing with a graphing utility.