Section A.13 Piecewise Defined Functions

We will encounter piecewise defined functions in differential equations when we think about some physical phenomenon. For example, we might consider the vibration of an airplane wing that is struck by some external object or a circuit that is initially open and then we close the circuit and the current immediately starts flowing. Both of these scenarios would require a piecewise defined function because there is a moment in time when something about the physical system changes.
As such, we need to remember how piecewise defined functions work. Consider the function
\begin{equation*} g(t) = \left\{ \begin{array}{ll} 0, \amp t \lt 1 \\ t^2, \amp 1 \le t \lt 2 \\ -t+1, \amp 2 \le t \lt 6 \\ 0, \amp t \ge 6. \\ \end{array} \right. \end{equation*}
If we want to evaluate the function at a particular \(t\)-value, we use the restrictions on the right to point us to which piece of the function definition we should use. For example, if we want to know \(g(3)\text{,}\) then we look over at that right side and see that 3 falls into the interval \(2 \le t \lt 6,\) so we use the corresponding function, \(-t+1\text{.}\) Thus, \(g(3) = -3 + 1 = -2.\)
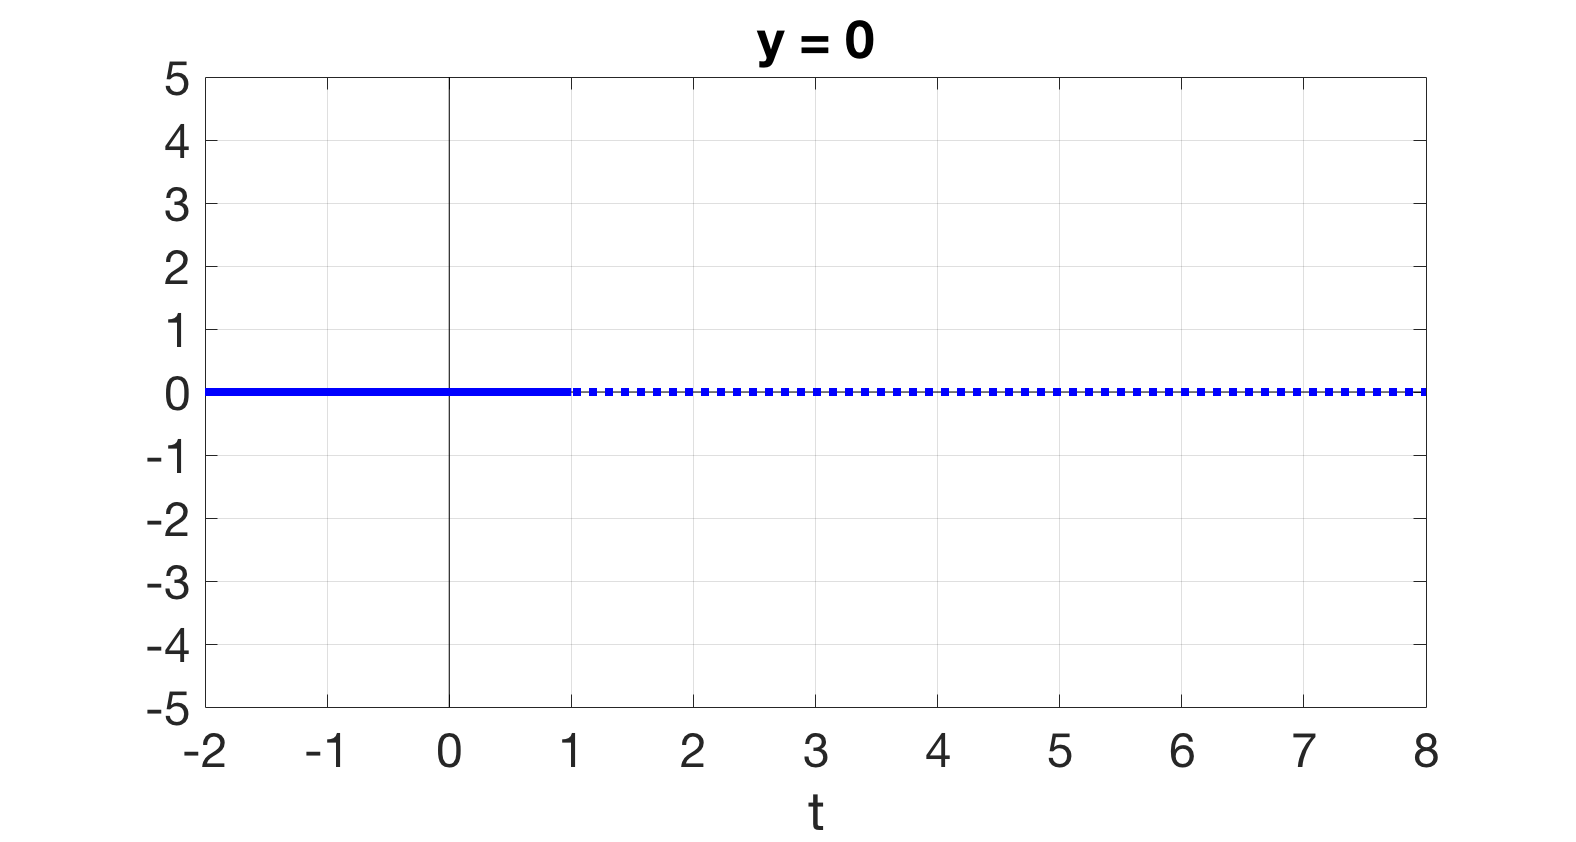
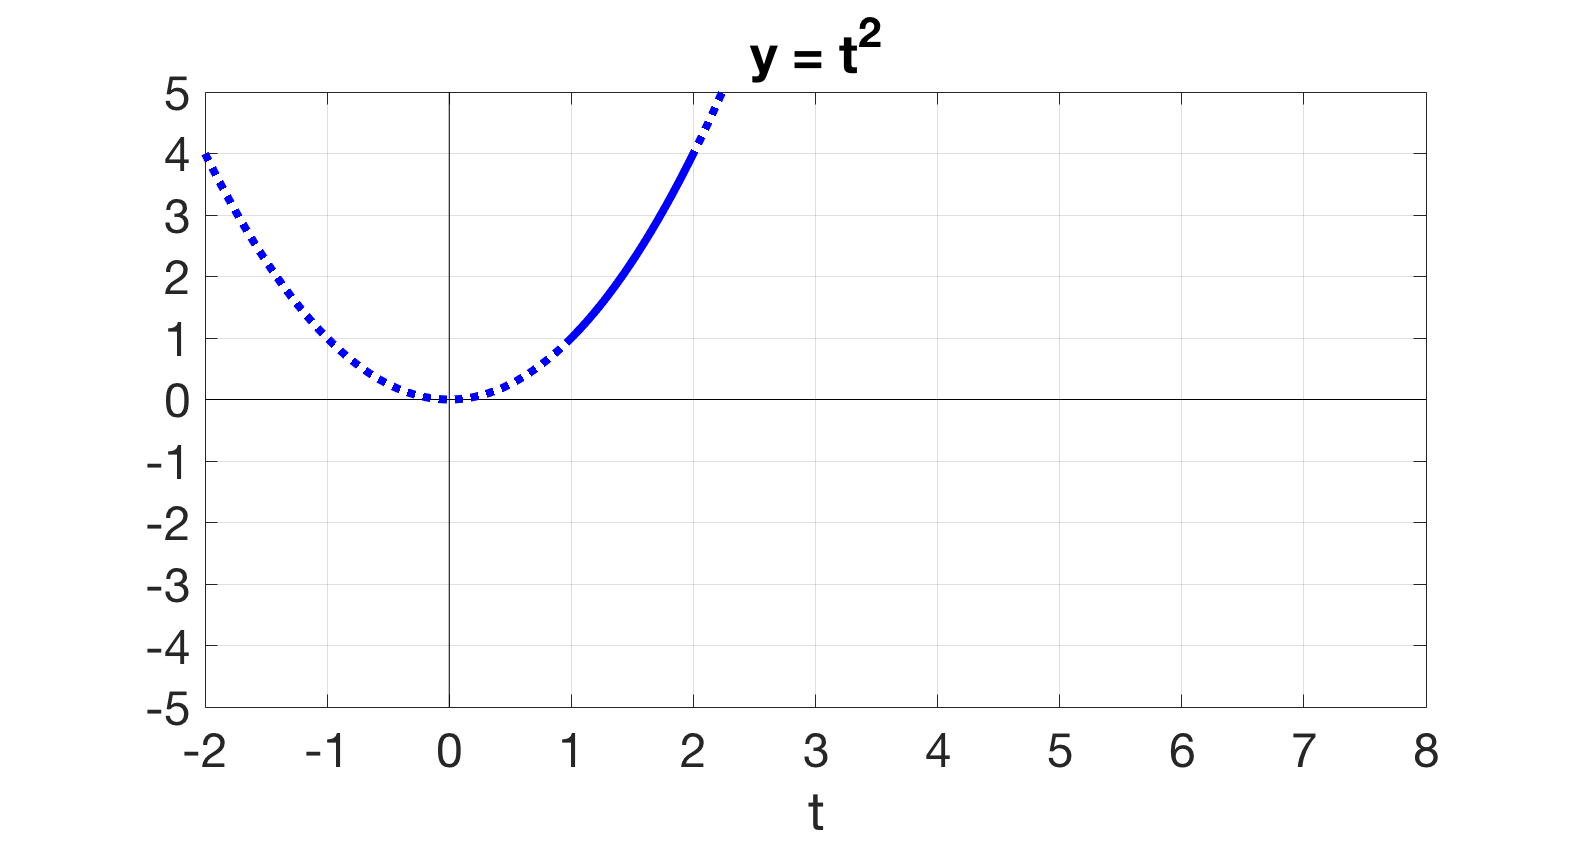
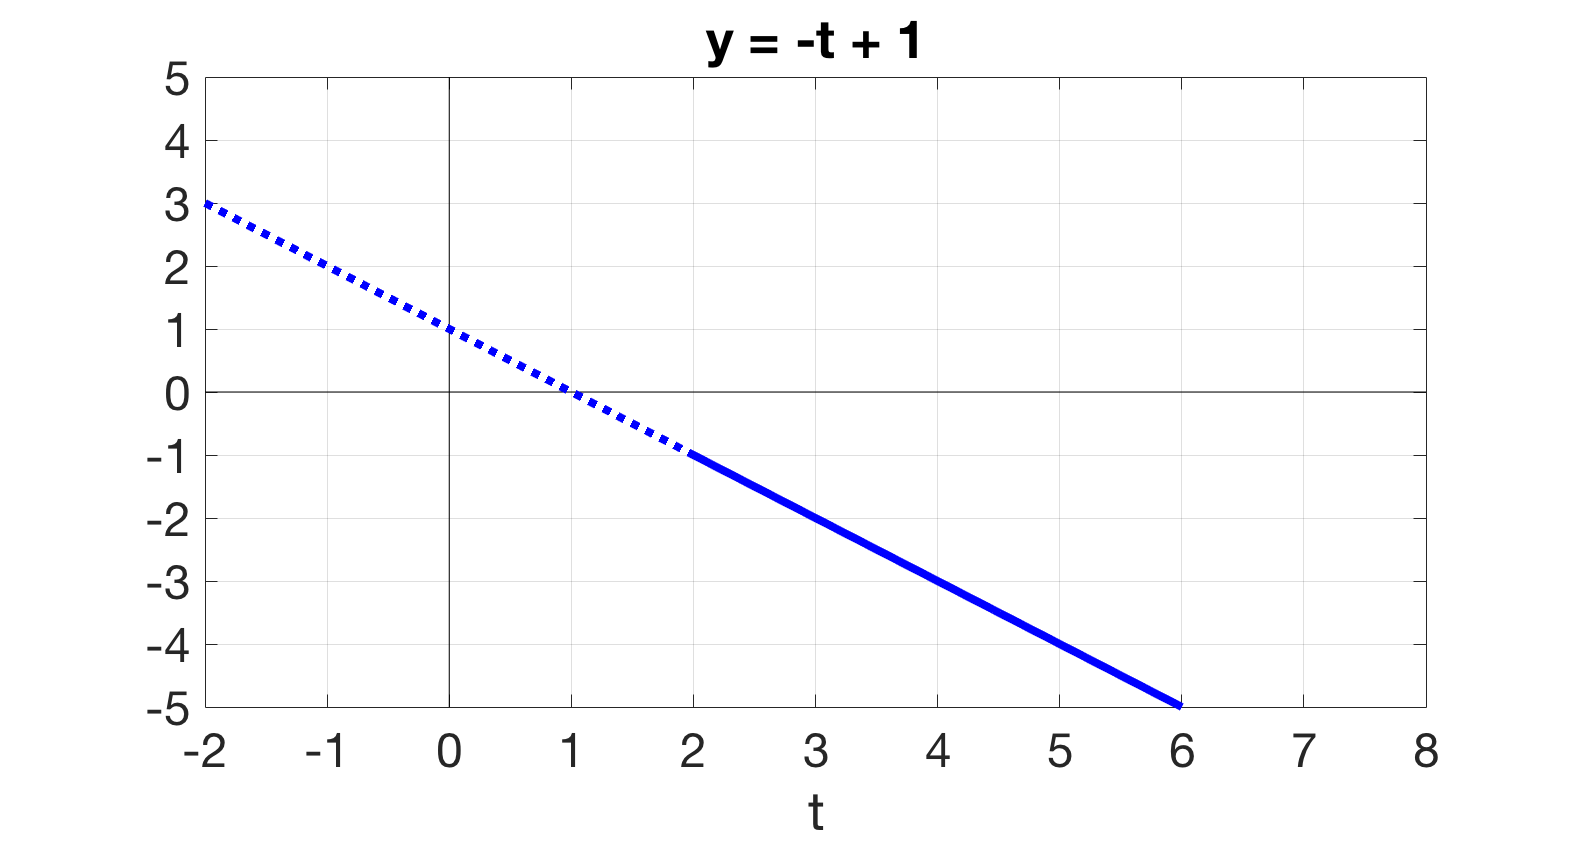
If we want to graph, we also use those restrictions. When \(t \lt 1\text{,}\) or equivalently when \(t\) is in the interval \((-\infty, 1),\) we know that the graph of \(g\) will look like the horizontal line \(y=0\text{;}\) on the interval \([1, 2),\) the graph will look like the graph of the parabola \(y = t^2\text{;}\) etc.
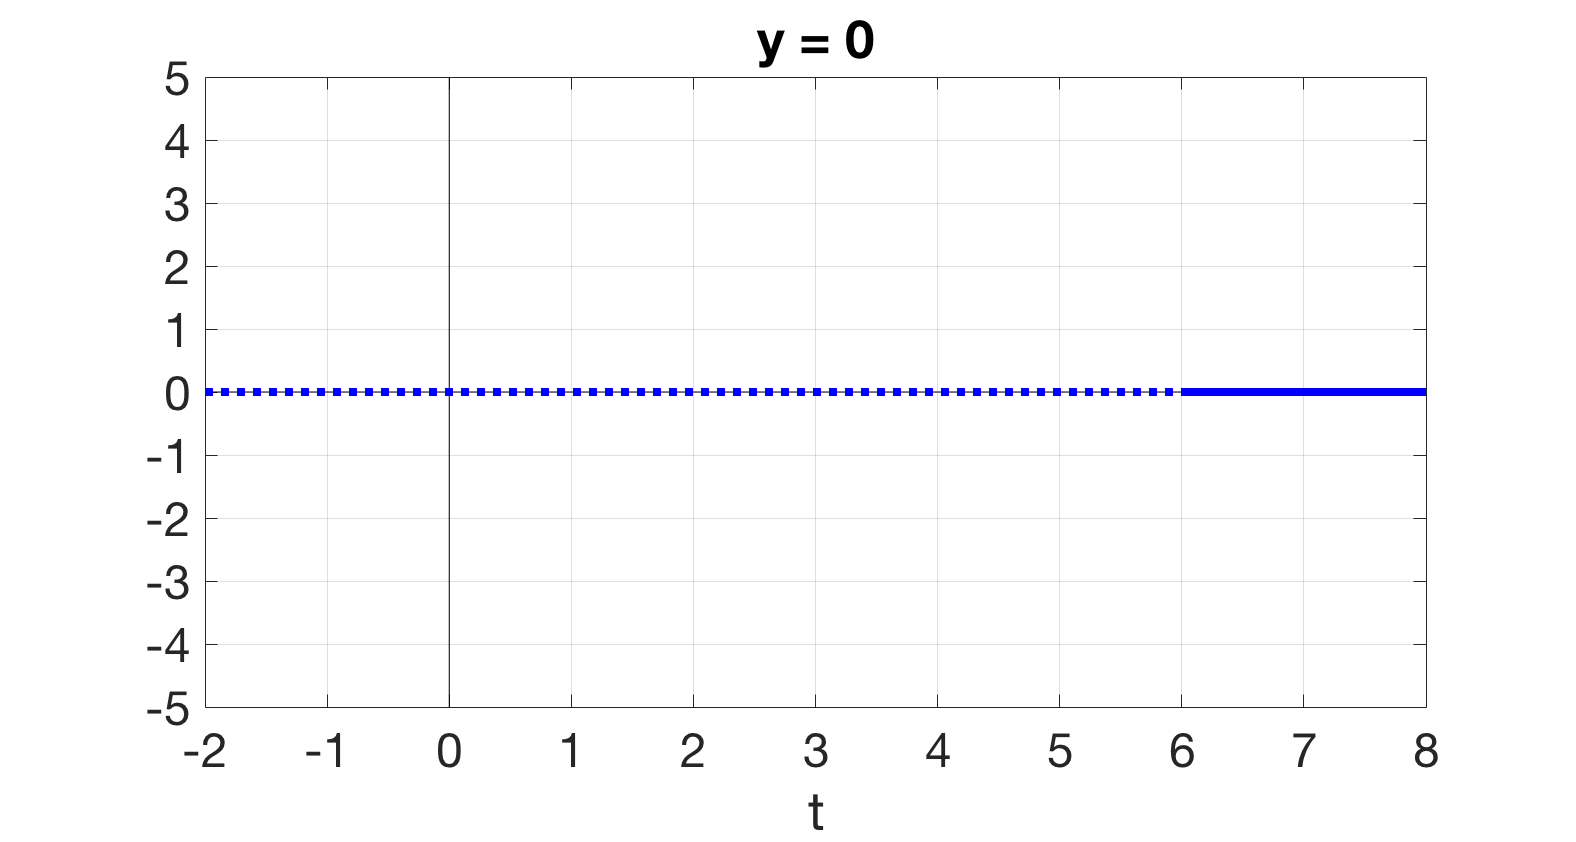
In the plots below you can see the entire graphs of the functions, dotted, with a solid segment that will be part of the piecewise function \(g\text{.}\)
Graph of y equals 0 along the t-axis. Solid left of t = 1 marks the piece used by g; the rest is dotted.
Graph of the parabola y equals t squared. Solid arc from t = 1 to 2, y = 1 to 4, marks the piece used by g; rest dotted.
Graph of the line y equals negative t plus 1. Solid from t = 2 to 6, y = -1 to -5, marks the piece used by g; rest dotted.
Graph of y equals 0 along the t-axis. Solid right of t = 6 marks the piece used by g; the rest is dotted.
Now we are prepared to assemble the pieces and generate the graph of the piecewise-defined function
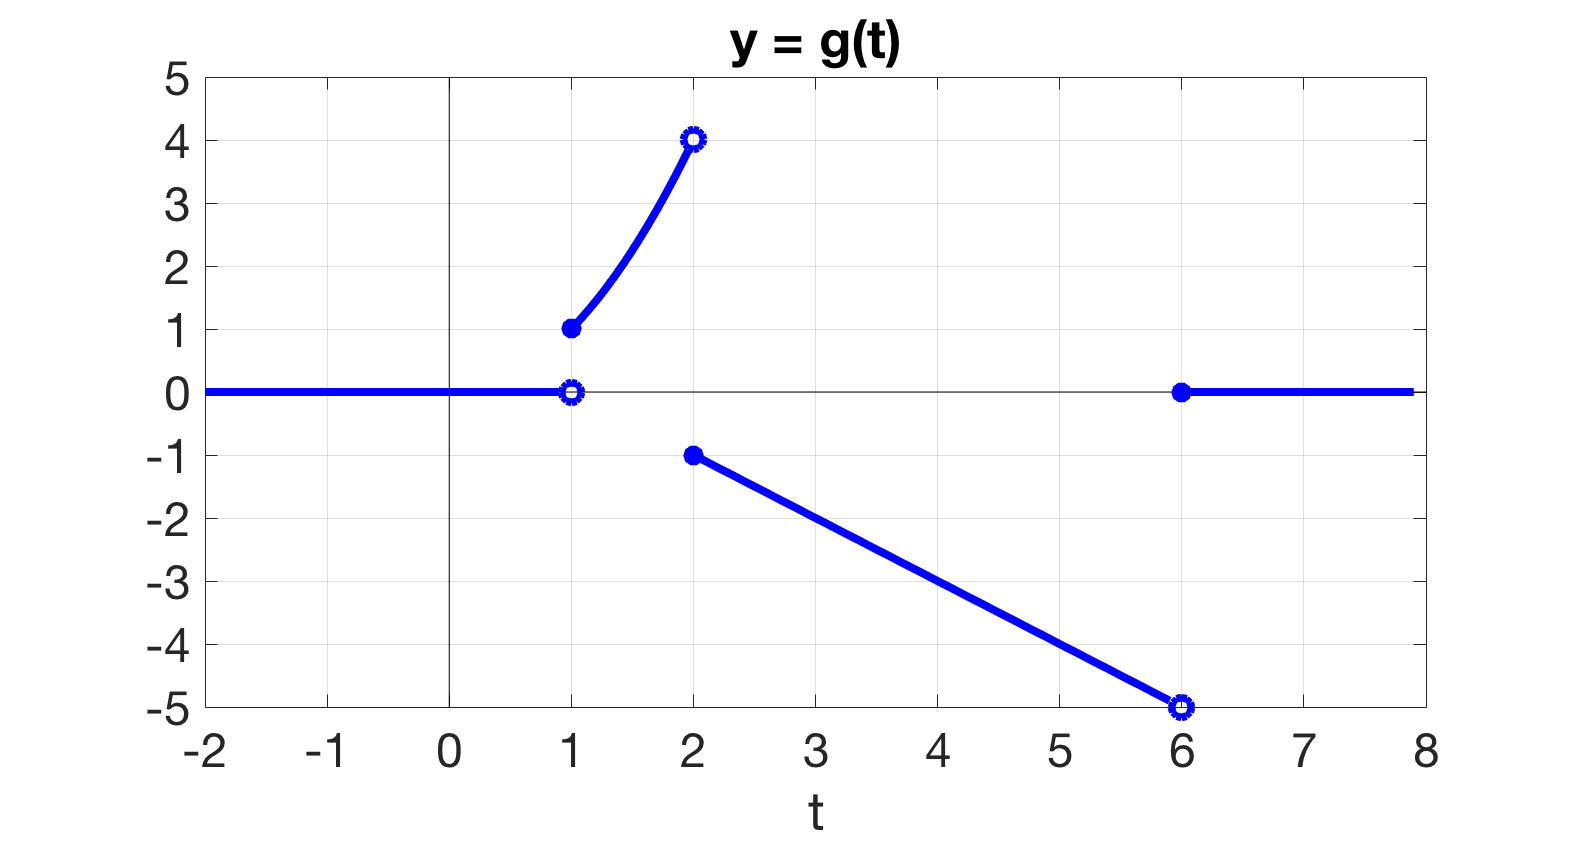
\begin{equation*} g(t) = \left\{ \begin{array}{ll} 0, \amp t \lt 1 \\ t^2, \amp 1 \le t \lt 2 \\ -t+1, \amp 2 \le t \lt 6 \\ 0, \amp t \ge 6 \\ \end{array} \right.\text{.} \end{equation*}
The assembled piecewise g: y = 0 to t = 1, parabola arc to (2,4), line down to (6,-5), then y = 0, jumps at t = 1, 2, 6.
Sketch each of the following piecewise defined functions.

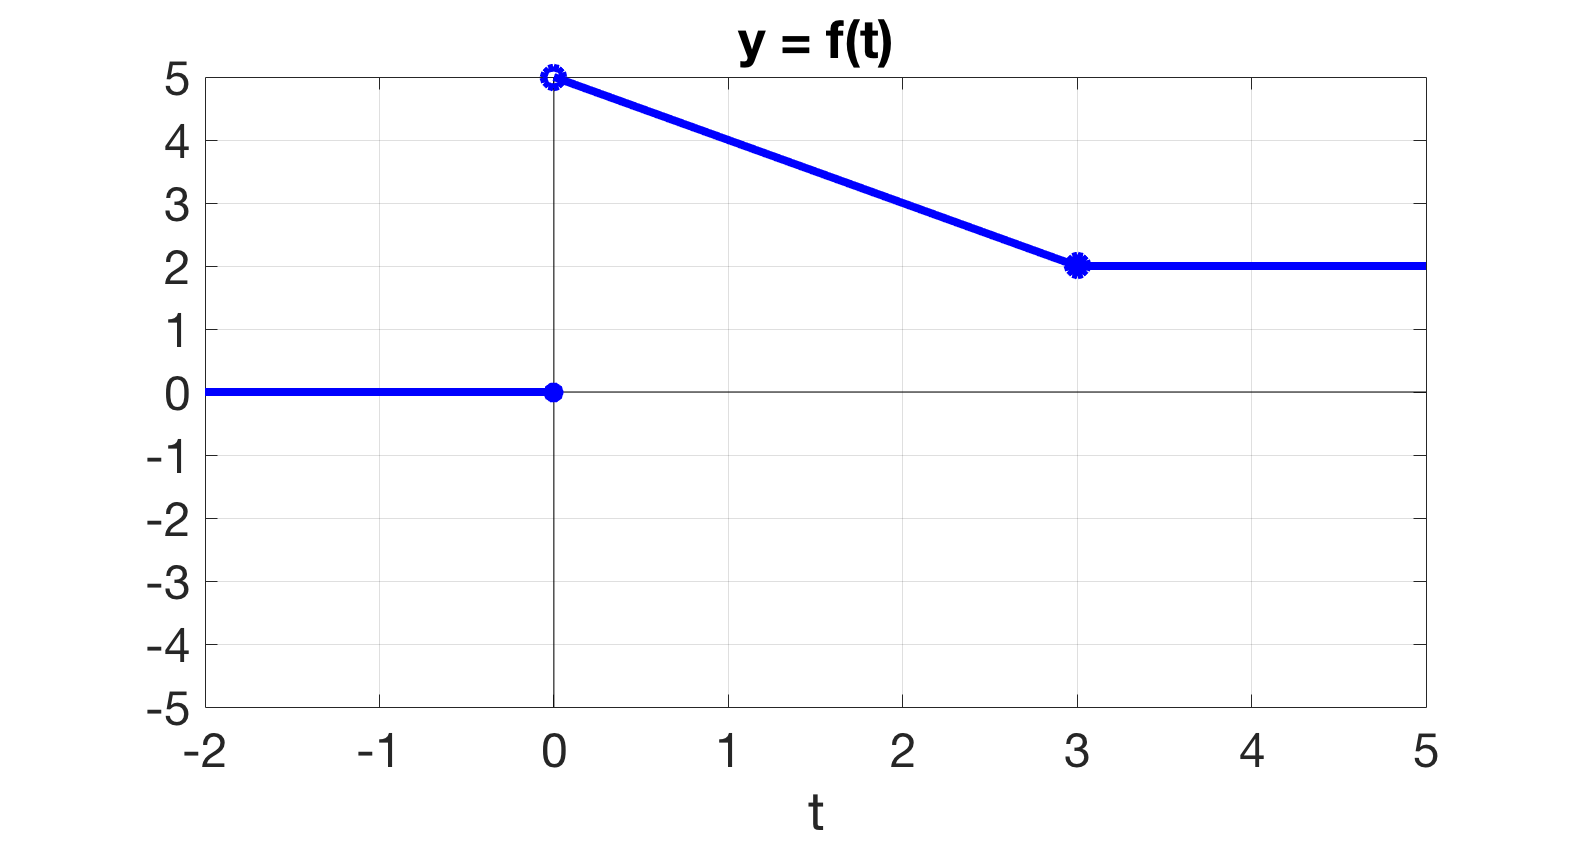
Checkpoint 357.

\(\ds f(t) = \left\{ \begin{array}{ll} 0, \amp t \lt 0 \\ 5-t, \amp 0 \le t \lt 3 \\ 2, \amp t \ge 3 \\ \end{array} \right.\)
Answer.

Checkpoint 358.

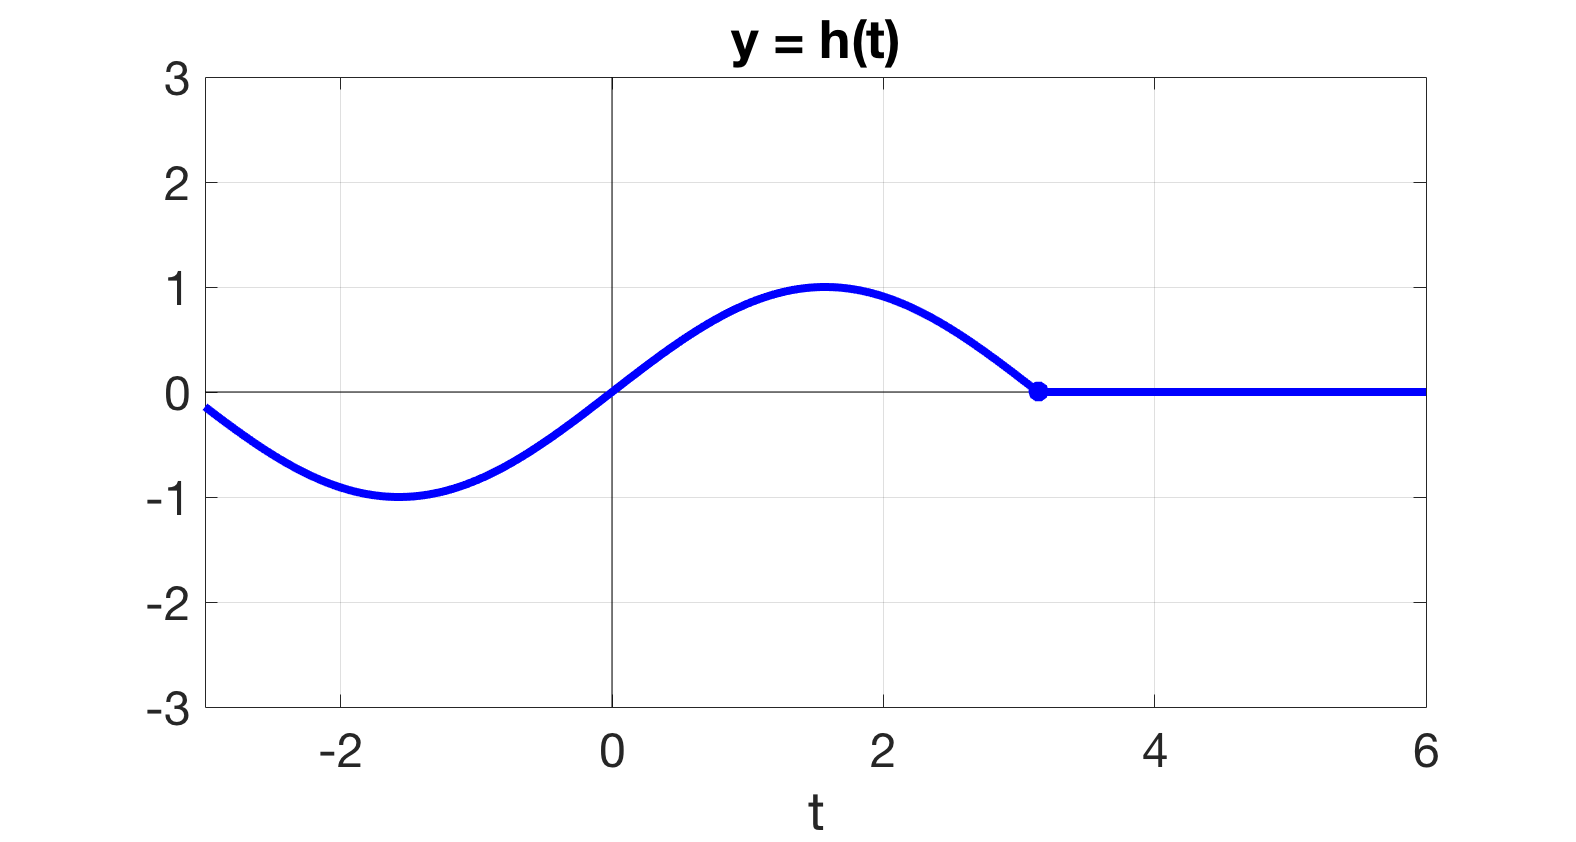
\(\ds h(t) = \left\{ \begin{array}{ll} \sin t, \amp t \lt \pi \\ 0, \amp t \ge \pi \\ \end{array} \right.\)
Answer.

Checkpoint 359.

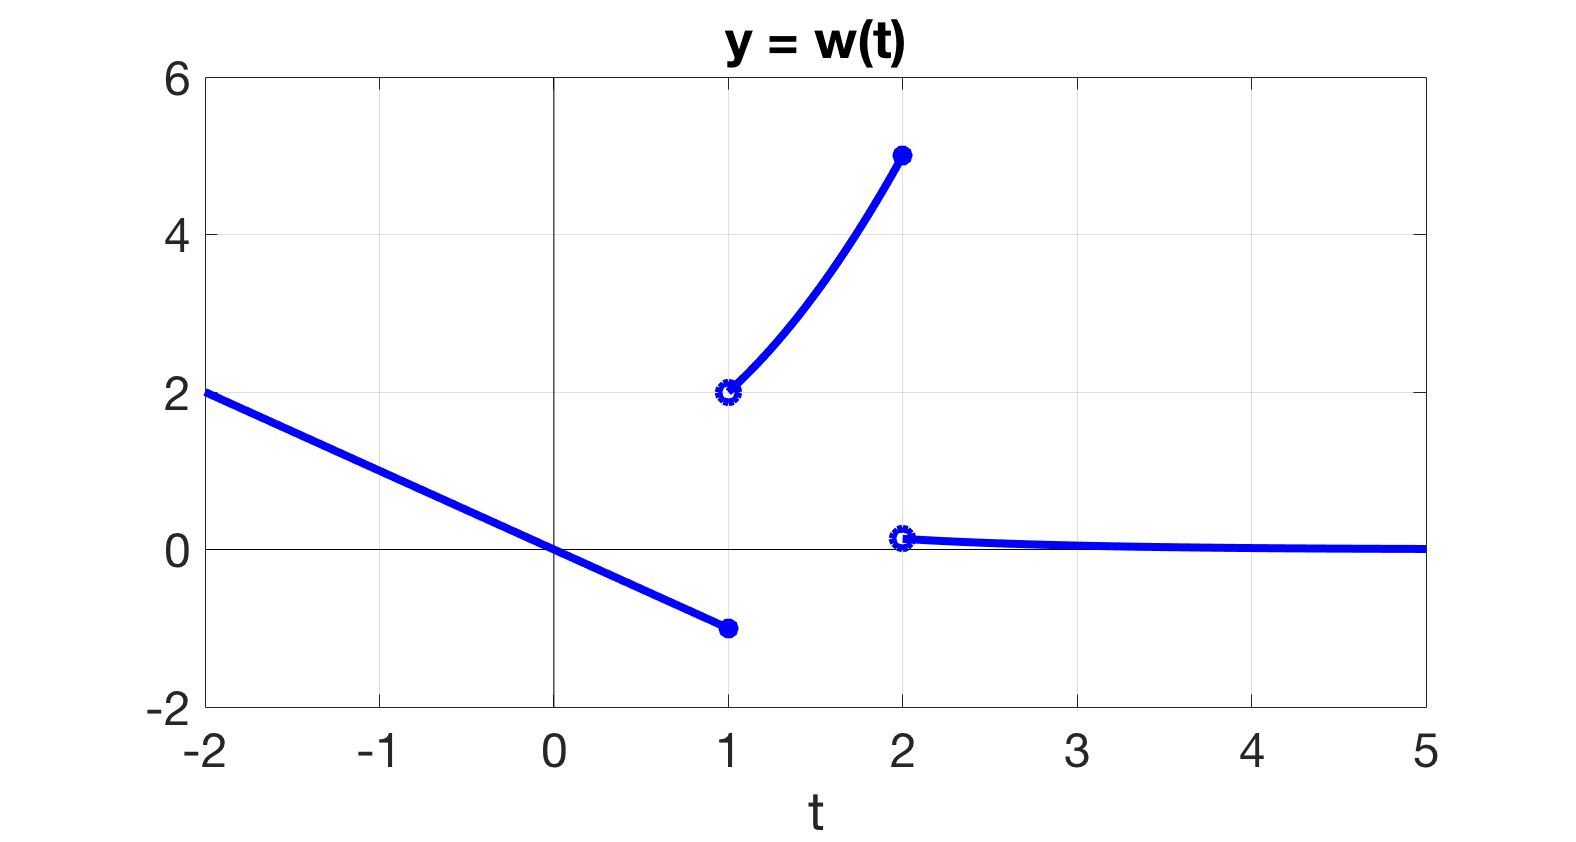
\(\ds w(t) = \left\{ \begin{array}{ll} -t, \amp t \lt 1 \\ t^2+1, \amp 1 \le t \lt 2 \\ e^{-t}, \amp t \ge 2 \\ \end{array} \right.\)
Answer.

Checkpoint 360 Matching Shifts of \(y=x^2\).

You have attempted of activities on this page.