Section 8.1 Periodic Functions

Many functions encountered in mathematics and in real-life applications display oscillatory, wave-like, or cyclical behavior; that is, the same cycle of a constant duration keeps repeating over and over again. Examples of this include the volume of the air in your lungs as you breathe in and out, the temperature of a room that is regulated by a thermostat, the height of the water in a harbor between the tides, and so on. In mathematics such cyclical functions are called periodic.

Example 8.1.1.

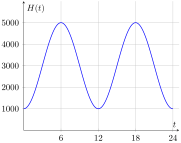
Each year a hare population, \(H = H(t)\text{,}\) in a national park changes with the seasons. The population is at its minimum of \(1000\) hares in January. In the summer, when the weather gets warm and the grass is green, the population grows in size to \(5000\text{.}\) By the following January, the population decreases again to \(1000\) hares. The same cycle repeats every year. Let \(t\) be measured in months and \(t = 0\) correspond to January. The graph of the population function \(H(t)\) is as follows:
Solution.
The behavior of this population function is cyclicalβ€”the function is periodic. The time needed for one full cycle to be executed is \(12\) months. We say the period of \(H(t)\) is \(12\) months. Note that for every time \(t\) the size of the population \(12\) months later, at time \(t + 12\text{,}\) is exactly the same as the population at \(t\text{.}\)
A precise definition of a periodic function is as follows.

Definition 8.1.2. Periodic Function.

A nonconstant function \(f\) is called periodic if a positive number \(P\) exists such that
\begin{equation*} f(t) = f(t + P) \end{equation*}
for all \(t\) in the domain of \(f\text{.}\) The smallest such \(P\) is called the period of \(f\text{.}\) If \(t\) is time, we can characterize the period as the shortest time needed for one full cycle of \(f\) to be executed.
The definition says that adding the period \(P\) to the input of the original function does not change the original output. In other words, the behavior of \(f(t)\) on the interval \(0 \leq t \leq P\) will be repeated on the interval \(P \leq t \leq 2P\text{,}\) and then again on the interval \(2P \leq t \leq 3P\text{,}\) and so on. The function executes the same cycle on every interval of duration \(P\text{.}\)
Besides the period, there are two other important numbers associated with a periodic function: the amplitude and the equilibrium. The latter is closely related to the concept of the midline.
In ExampleΒ 8.1.1 the period is \(12\) months. The maximum value of \(H\) is \(h_\text{max} = 5000\) and the minimum value is \(h_\text{min} = 1000\text{.}\) Hence, the amplitude is
\begin{equation*} \frac{5000 - 1000}{2} = \frac{4000}{2} = 2000. \end{equation*}
The equilibrium is
\begin{equation*} \frac{5000 + 1000}{2} = 3000. \end{equation*}
The midline is the horizontal line through \(3000\text{;}\) that is, the line \(H = 3000\text{.}\) The graph of \(H(t)\) above illustrates all three concepts.
We can characterize the amplitude, equilibrium, and midline in intuitive terms as follows:

Example 8.1.5.

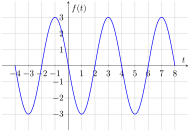
Find the period, amplitude, equilibrium, and midline of the function \(y = f(t)\) whose graph is given below.
Solution.
At \(t = 0\) the function starts from the value \(f(0) = 0\text{.}\) As \(t\) increases, \(f(t)\) decreases all the way to \(-3\text{.}\) Then \(f(t)\) starts increasing, reaches \(0\) again at \(t = 2\text{,}\) continues increasing to the value \(3\text{,}\) and decreases back to \(0\) at \(t = 4\text{.}\) After \(t = 4\text{,}\) the same cycle repeats between \(t = 4\) to \(t = 8\text{:}\) decreasing to \(-3\text{,}\) increasing to \(0\text{,}\) increasing to \(3\text{,}\) decreasing back to \(0\text{.}\) The function executes the same cycle every \(4\) units of \(t\text{.}\)
Hence, \(f(t)\) is periodic with the period \(4\text{.}\) To calculate the amplitude and the equilibrium, notice that \(y_\text{min} = -3\) and \(y_\text{max} = 3\text{.}\) Therefore,
\begin{align*} \text{period} \amp= 4\\ \text{amplitude} \amp= \frac{y_\text{max} - y_\text{min}}{2} = \frac{3 - (-3)}{2} = \frac{3 + 3}{2} = 3\\ \text{equilibrium} \amp= \frac{y_\text{max} + y_\text{min}}{2} = \frac{3 + (-3)}{2} = \frac{3 - 3}{2} = 0. \end{align*}
The midline is the horizontal line through the equilibrium, which has equation
\begin{equation*} y = 0. \end{equation*}
The function \(f(t)\) oscillates around the equilibrium \(y = 0\text{,}\) varying between \(3\) units down and \(3\) units up from the equilibrium; that is, with amplitude \(3\text{.}\) It executes one full cycle over any interval of duration \(4\text{.}\)
Example 8.1.6.

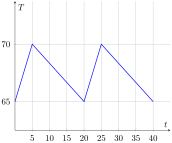
The temperature of a room, \(T(t)\text{,}\) in \({}^{\circ} \mathrm{F}\text{,}\) is regulated by a thermostat. The thermostat triggers the heat to go on when the temperature drops to \(65^{\circ} \mathrm{F}\) and shuts the heat at \(70^{\circ} \mathrm{F}\text{.}\) Below is the graph of the temperature function \(T(t)\text{,}\) \(t\) is measured in minutes.
  1. Find the period, amplitude, equilibrium, and the midline.
  2. Suppose that \(t = 0\) corresponds to 12 p.m. What is the temperature in the room at 12:45 p.m.?
  3. Sketch the midline on the graph of the function.
Solution.
  1. The function \(T(t)\) reaches its peak once a cycle. The distance between two peaks is \(20\) minutes, so the period is \(20\) minutes. The maximum and minimum values of the temperature are \(T_\text{max} = 70\) and \(T_\text{min} = 65\) respectively. Therefore,
    \begin{align*} \text{period} \amp= 20\\ \text{amplitude} \amp= \frac{T_\text{max} - T_\text{min}}{2} = \frac{70 - 65}{2} = \frac{5}{2} = 2.5\\ \text{equilibrium} \amp= \frac{T_\text{max} + T_\text{min}}{2} = \frac{70 + 65}{2} = \frac{135}{2} = 67.5 \end{align*}
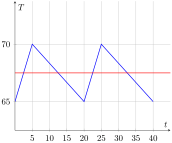
    The midline is the horizontal line through the equilibrium; that is, the line with the equation \(T = 67.5\text{.}\)
  2. Because the period is \(20\text{,}\) then \(T(t + 20) = T(t)\) for all values of \(t\text{.}\) The graph of the function reveals that \(T(25) = 70^{\circ} \mathrm{F}\text{.}\) Therefore, \(T(45) = T(25 + 20) = T(25) = 70^\circ \mathrm{F}\text{.}\)
  3. We found the midline to be \(T = 67.5\text{,}\) which is shown in red on the following graph.

Exercises Exercises

1.

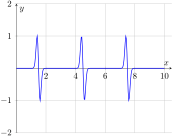
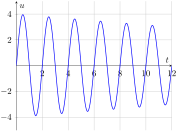
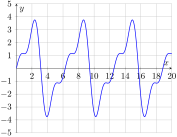
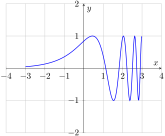
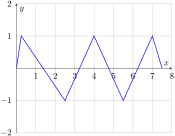
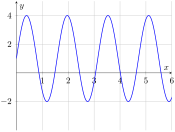
Determine whether each function graphed below is a periodic function. For those that are periodic, approximate the amplitude, midline, and period.
Figure 8.1.7.
Figure 8.1.8.
Figure 8.1.9.
Figure 8.1.10.
Figure 8.1.11.
Figure 8.1.12.
Solution.

2.

Each day, the tide in a harbor continuously goes in and out, raising and lowering a boat anchored there. At low tide, the boat is only \(2\) meters above the ocean floor. Six hours later, at peak high tide, the boat is \(20\) meters above the ocean floor. Six hours after peak high tide, it is low tide again. Suppose the boat is at high tide at midnight.

(a)

Sketch and label a periodic function \(D(t)\) modeling the boat’s distance above the ocean floor as a function of time \(t\) hours since midnight.
Solution.
Answers will vary; a correct sketch is periodic with the period, amplitude, and midline identified in part (b).

(b)

Identify the period, amplitude, and midline of the periodic function.
Solution.
period: \(12\text{;}\) amplitude: \(9\text{;}\) midline: \(y=11\)

3.

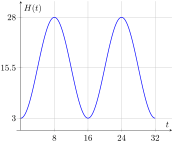
You decide to ride the Ferris wheel at the local carnival. You are \(3\) feet above the ground at the bottom of the Ferris wheel and \(28\) feet above the ground at the top. It takes \(8\) seconds for you to reach the maximum height from the minimum height and \(8\) seconds to reach the minimum height from the maximum height. Suppose you are at the bottom of the ride at time \(t=0\) seconds.

(a)

Sketch and label a periodic function \(H(t)\) modeling your height above the ground \(t\) seconds into your Ferris wheel ride.
Solution.

(b)

Identify the period, amplitude, and midline of the periodic function.
Solution.
period: \(16\text{;}\) amplitude: \(12.5\text{;}\) midline: \(y=15.5\)
You have attempted of activities on this page.