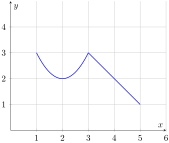
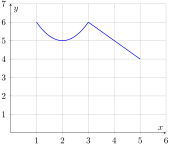
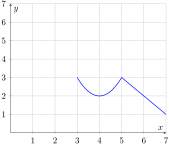
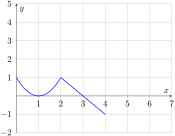
What happens if we change the function \(f(x) = x^2\) by adding or subtracting a number from it? For instance, what would the graphs of \(g(x) = x^2 + 1\) and \(h(x) = x^2 - 3\) look like? In this case, the graph of \(g(x) = x^2 + 1\) is the graph of \(f(x) = x^2\)shifted up one unit and the graph of \(h(x) = x^2 - 3\) is the graph of \(f(x) = x^2\)shifted down 3 units.
In general, if we begin with the graph of a function \(y = f(x)\text{,}\) then the function \(g(x) = f(x) + k\) can be given by the formula \(g(x) = y + k\text{.}\) That is, the \(y\)-values of \(g(x)\) are the \(y\)-values of \(f(x)\) adjusted by the addition of the number \(k\text{.}\) Hence, the graph of \(g(x) = f(x) + k\) is the graph of \(f(x)\) shifted either upward or downward depending upon the value of \(k\text{.}\)
Given a function \(f(x)\) and a constant \(k\text{,}\)\(g(x) = f(x) + k\) is a vertical shift of the graph of \(f(x)\text{.}\) If \(k\) is positive, then:
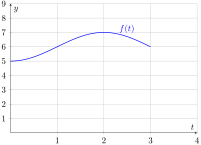
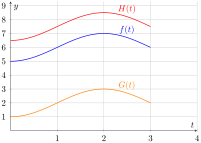
The graph of \(G(t) = f(t) - 4\) is the graph of \(f(t)\) shifted down 4 units while the graph of \(H(t) = f(t) + 1.5\) is the graph of \(f(t)\) shifted up 1.5 units. Hence, we have the following.
The total monthly cost \(C\) to operate a company depends upon the fixed costs for facility rental and equipment as well as the number of units, \(p\text{,}\) that the company produces that month. The table below shows this relationship for a typical month.
Suppose the rent on the facility went up by \(\$200\) per month. Create a table for the resulting total monthly cost function \(S\) as a function of the number of units produced, \(p\text{.}\)
The outputs in the original table give the original total monthly cost as a function of the number of units produced, \(p\text{.}\) If the rent were to go up by \(\$200\) per month, then the resulting total monthly cost function would be \(S = C + 200\text{.}\) This is a vertical shift of the original cost function \(C\text{,}\) and values for it can be obtained by adding 200 to each of the outputs in the original table, as can be seen below.
We saw that adding or subtracting a number from the output of a function results in a vertical shift. What happens if we add or subtract a number from the input of a function instead?
For instance, we know that \(y = \sqrt{x} + 2\) would result in shifting the function \(f(x) = \sqrt{x}\) up two units. But what if we added or subtracted a number under the square root instead—that is, from the input of the function rather than the output?
To illustrate, we will consider the functions \(g(x) = \sqrt{x + 2}\) and \(h(x) = \sqrt{x - 3}\text{.}\) The graph of \(g(x) = \sqrt{x + 2}\) is the graph of \(f(x) = \sqrt{x}\) shifted left two units while \(h(x) = \sqrt{x - 3}\) is the graph of \(f(x) = \sqrt{x}\) shifted right 3 units.
To help explain why this is the case, notice that the formula \(f(x) = \sqrt{x} = y\) is solved for \(y\) and not \(x\text{.}\) We can change this by squaring both sides of \(\sqrt{x} = y\text{:}\)
\begin{equation*}
x = y^2.
\end{equation*}
If we were then to solve the formula \(g(x) = \sqrt{x + 2} = y\) for \(x\text{,}\) we would square both sides of \(\sqrt{x+2} = y\) and then subtract 2:
\begin{align*}
x + 2 \amp= y^2\\
x + 2 \textcolor{blue}{-2} \amp= y^2 \textcolor{blue}{-2}\\
x \amp= y^2 - 2.
\end{align*}
Notice that the formula for the \(x\)-values of \(g(x) = \sqrt{x + 2}\) involves subtracting\(2\) from the formula for the \(x\)-values of the original function \(f(x) = \sqrt{x}\text{.}\) This means that for each specific \(y\)-value, the corresponding \(x\)-value of \(g(x) = \sqrt{x + 2}\) is two units in the negative direction from that of the original function \(f(x) = \sqrt{x}\text{;}\) that is, two units to the left.
Given a function \(f(x)\) and a constant \(h\text{,}\)\(g(x) = f(x + h)\) is a horizontal shift of the graph of \(f(x)\text{.}\) If \(h\) is positive, then
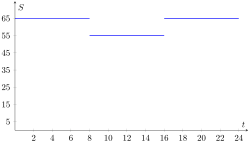
In an effort to save on heating costs, the thermostat in a professor’s home has been programmed to keep his house at 65 degrees while he is home from 4pm to 8am the following day and to drop the temperature to 55 degrees while he is at work from 8am to 4pm each day. This is illustrated in the graph below, where \(t\) corresponds to hours past since midnight and \(S\) corresponds to the thermostat setting.
Due to a schedule change requiring him to teach a night class, the professor needs to shift his entire work schedule later by four hours and hence adjust his thermostat setting accordingly. Sketch a graph reflecting this change.
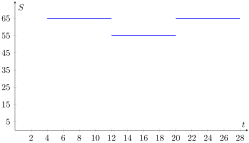
Shifting his entire work schedule forward by 4 hours is equivalent to moving it forward in time by 4 hours. This corresponds to a horizontal shift to the right 4 units. This means that we must graph the corresponding horizontal shift \(S(t - 4)\text{.}\)
Note that the original graph shows a thermostat setting of 55 degrees between times \(t = 8\) and \(t = 16\text{,}\) corresponding to a work day stretching from 8am to 4pm. The shifted graph shows a thermostat setting of 55 degrees between times \(t = 12\) and \(t = 20\text{,}\) corresponding to a work day stretching from 12pm to 8pm (pushed back 4 hours, as it was intended).
The function \(g(x) = f(x + 6.2)\) is a horizontal shift of \(f(x)\text{;}\) its graph would be the graph of \(f(x)\) shifted to the left \(6.2\) units. This means that to construct a table for \(g(x)\text{,}\) we should take the table for \(f(x)\) and subtract \(6.2\) from each of the inputs while leaving the outputs unchanged.
SubsectionCombining Vertical and Horizontal Shifts
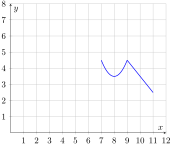
Shifting vertically and shifting horizontally are two illustrations of transformations of functions; they take an original function and transform (or change) it by shifting it in some way. Multiple transformations may be applied to an original function; for instance, both a vertical and a horizontal shift can be applied to an original function: The graph of the function \(y = (x + 2)^2 - 7\) is obtained by shifting the graph of \(f(x) = x^2\) down \(7\) units and left \(2\) units.
The original function is \(f(x) = x^5\text{.}\) Since \(4\) is being added on the end, the vertical shift is up \(4\) units. Since \(10\) is being subtracted from the input variable \(x\text{,}\) the horizontal shift is right \(10\) units.
The original function is \(f(t) = {2}^{t}\text{.}\) Since \(3\) is being added on the end, the vertical shift is up \(3\) units. Since \(1\) is being added to the input variable \(t\text{,}\) the horizontal shift is left \(1\) unit.
To shift up \(1\) unit, we add \(1\) to the whole function and to shift to the left \(4\) units we add \(4\) to the input variable \(t\) in the exponent. Hence, the new function will have formula \(y = 10{(0.5)}^{t + 4} + 1\text{.}\)
To shift down \(4\) units, we subtract \(4\) from the whole function and to shift to the right \(3\) units we subtract \(3\) from the input variable \(x\) under the cube root. Hence, the new function will have the formula \(y = \sqrt[3]{x - 3} - 4\text{.}\)
Write the formula for a function \(g(t)\) that represents the temperature (in degrees Fahrenheit) of the water in the spa if the spa heater is turned on \(15\) minutes earlier.
Write a formula for the function \(h(t)\) that represents the temperature (in degrees Fahrenheit) of the water in the spa if the temperature of the water in the spa were \(5\) degrees warmer at the time that the heater was turned on.
The function \(C(t)\) gives the concentration (in nanograms per milliliter) of a certain medication in a patient’s bloodstream \(t\) minutes after a dose of the medication has been administered to a patient, assuming that the patient has \(0\) nanograms per milliliter in their bloodstream at time \(t=0\text{.}\) Write the formula for the function \(g(t)\) that supposes that at time \(t=0\) the patient had \(2.3\) nanograms per milliliter of the medication in their bloodstream.