Starlings often feed in flocks, and their rate of feeding depends on the size of the flock. If the flock is too small, the birds are nervous and spend a lot of time watching for predators. If the flock is too large, the birds become overcrowded and fight each other, which interferes with feeding. Here are some data gathered at a feeding station. The data show the number of starlings in the flock and the total number of pecks per minute recorded at the station while the flock was feeding. (Source: Chapman & Reiss, 1992)
For each flock size, calculate the number of pecks per starling per minute. For purposes of efficient feeding, what flock size appears to be optimum? How many pecks per minute would each starling make in a flock of optimal size?
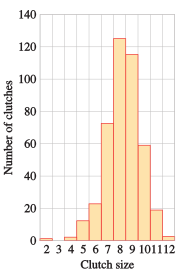
Biologists conducted a four-year study of the nesting habits of the species Parus major in an area of England called Wytham Woods. The bar graph shows the clutch size (the number of eggs) in 433 nests. (Source: Perrins and Moss, 1975)
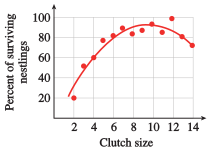
The average weight of the nestlings declines as the size of the brood increases, and the survival of individual nestlings is linked to their weight. A hypothetical (and simplified) model of this phenomenon is described by the table below. Calculate the number of surviving nestlings for each clutch size. Which clutch size produces the largest average number of survivors?
Find the optimal clutch size for maximizing the number of surviving nestlings. How does this optimum clutch size compare with the most frequently observed clutch size in part (a)?
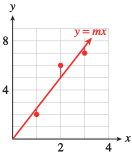
In this project, we minimize a quadratic expression to find the line of best fit. The figure shows a set of three data points and a line of best fit. For this example, the regression line passes through the origin, so its equation is \(y = mx\) for some positive value of \(m\text{.}\) How shall we choose m to give the best fit for the data? We want the data points to lie as close to the line as possible. One way to achieve this is to minimize the sum of the squares of the vertical distances shown in the figure.
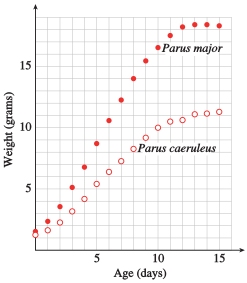
Describe the rate of growth for each species over the first 15 days of life. How are the growth rates for the two species similar, and how are they different?
Find the vertex of the graph of the regression equation. How does this estimate for the maximum growth rate compare with your estimate in Project 6.134?
Find the vertex of the graph of the regression equation. How does this estimate for the maximum growth rate compare with your estimate in Project 6.134?