Subsection Graphs of Inequalities in Two Variables
Ivana is investing in the hotel business. She has bought two hotels, and she will expand her investments when her total profit from the two hotels exceeds \($10,000\text{.}\) If we let \(x\) represent the profit from one hotel and let \(y\) represent the profit from the other, then Ivana will expand her investments when
\begin{equation*}
x + y \ge 10,000
\end{equation*}
Notice that the equation \(x + y = 10,000\) is not appropriate to model our situation, since Ivana will be delighted if her profits are not exactly equal to \($10,000\) but actually exceed that amount.
A
solution to an inequality in two variables is an ordered pair of numbers that satisfies the inequality. The graph of the inequality must show all the points whose coordinates are solutions. As an example, let us graph the inequality above,
\(x + y \ge 10,000\text{.}\)
Rewrite the inequality by subtracting \(x\) from both sides to get
\begin{equation*}
y \ge -x + 10,000
\end{equation*}
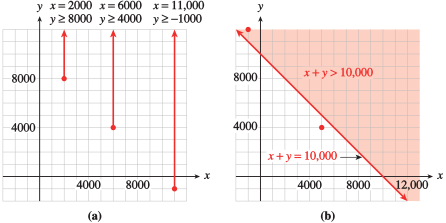
This inequality says that for each \(x\)-value, we must choose points with \(y\)-values greater than or equal to \(-x + 10,000\text{.}\) For example, when \(x = 2000\text{,}\) we must choose points with \(y\)-values greater than or equal to \(8000\text{.}\) Solutions for several choices of \(x\) are shown in figure (a).
A more efficient way to find all the solutions of the inequality is to start with the graph of the corresponding equation
\begin{equation*}
y = -x + 10,000
\end{equation*}
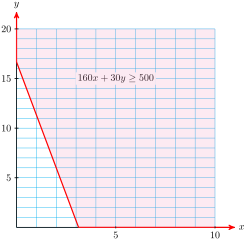
The graph is a straight line, as illustrated in figure (b). Observe that any point above this line has a y-coordinate greater than \(-x + 10,000\) and hence satisfies the inequality. Thus, the graph of the inequality includes all the points on or above the line \(y = -x + 10,000\text{,}\) as shown by the shaded region in figure (b).
You can check that the shaded points are also solutions to the original inequality, \(x + y \ge 10,000\text{.}\) Consider the point \((-1000, ~12,000)\text{,}\) which lies in the shaded region above the line. This pair does satisfy \(x + y \ge 10,000\text{,}\) because
\begin{equation*}
-1000 + 12,000 \ge 10,000
\end{equation*}
(Ivana will expand her investments if her first hotel loses $\(1000\) and her second has a profit of $\(12,000\text{.}\)) On the other hand, the point \((5000, 4000)\) does not lie in the graph of \(x + y \ge 10,000\text{,}\) because the coordinates do not satisfy the inequality.
Subsection Linear Inequalities
A linear inequality can be written in the form
\begin{equation*}
ax + by + c \le 0 ~~~\text{ or }~~~ ax + by + c \ge 0
\end{equation*}
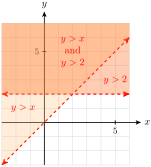
The solutions consist of the line \(ax + by + c = 0\) and a half-plane on one side of that line. We shade the half-plane to show that all its points are included in the solution set. If the inequality is strict, then the graph includes only the half-plane and not the line. In that case, we use a dashed line for the graph of the equation \(ax + by + c = 0\) to show that it is not part of the solution.
To decide which side of the line to shade, we can solve the inequality for \(y\) in terms of \(x\text{.}\) If we obtain
\begin{equation*}
y \ge mx + b ~~~(\text{or }~~~y \gt mx + b)
\end{equation*}
then we shade the half-plane above the line. If the inequality is equivalent to
\begin{equation*}
y \le mx + b ~~~(\text{or }~~~y \lt mx + b)
\end{equation*}
then we shade the half-plane below the line.
Example 8.66.
Graph
\(~~4x - 3y \ge 12\)
Solution.
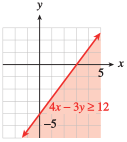
We solve the inequality for \(y\text{.}\)
\begin{equation*}
\begin{aligned}[t]
4x - 3y \amp\ge 12 \amp \amp \blert{\text{Subtract}~ 4x~ \text{from both sides.}}\\
-3y\amp\ge -4x + 12 \amp \amp \blert{\text{Divide both sides by}~ -3.}\\
y\amp\le \frac{4}{3}x-4
\end{aligned}
\end{equation*}
We graph the corresponding line
\begin{equation*}
y = \frac{4}{3}x-4
\end{equation*}
Note that the
\(y\)-intercept is
\(-4\) and the slope is
\(\dfrac{4}{3}\text{.}\) (See
Section 1.5 to review the slope-intercept method of graphing.) Finally, we shade the half-plane below the line. The completed graph is shown below.
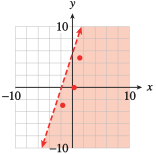
Checkpoint 8.67 Practice 1.
-
Find one
\(y\)-value that satisfies the inequality
\(y - 3x \lt 6\) for each of the
\(x\)-values in the table.
| \(x\) |
\(1\) |
\(0\) |
\(-2\) |
| \(y\) |
\(\hphantom{00}\) |
\(\hphantom{00}\) |
\(\hphantom{00}\) |
-
Graph the line
\(y - 3x = 6\text{.}\) Then plot your solutions from part (a) on the same grid.
-
Graph the solutions of the inequality
\(y - 3x \lt 6\text{.}\)
Solution.
-
| \(x\) |
\(1\) |
\(0\) |
\(-2\) |
| \(y\) |
\(\alert{5} \) |
\(\alert{0}\) |
\(\alert{-3}\) |
-
-
Checkpoint 8.68 QuickCheck 1.
The solutions of
\(x \gt -4\) all lie to which side of the boundary line?
Subsection Using a Test Point
A second method for graphing inequalities does not require us to solve for
\(y\text{.}\) Once we have graphed the boundary line, we can decide which half-plane to shade by using a test point. The test point can be any point that is not on the boundary line itself.
Example 8.69.
Graph the solutions of the inequality
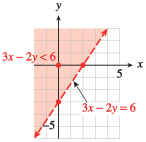
\(~~3x - 2y\lt 6\)
Solution.
First, we graph the line
\(3x - 2y = 6\text{,}\) as shown below. We will use the intercept method. The intercepts are
\((2, 0)\) and
\((0, -3)\text{,}\) so we sketch the boundary line through those points.
Next, we choose a test point. Because \((0, 0)\) does not lie on the line, we choose it as our test point. We substitute the coordinates of the test point into the inequality to obtain
\begin{equation*}
3(\alert{0}) - 2(\alert{0}) \lt 6
\end{equation*}
Because this is a true statement, \((0, 0)\) is a solution of the inequality. Since all the solutions lie on the same side of the boundary line, we shade the half-plane that contains the test point. In this example, the boundary line is a dashed line because the original inequality was strict.
We can choose
any point for the test point as long as it does not lie on the boundary line. We chose
\((0, 0)\) in
Example 8.69 because the coordinates are easy to substitute into the inequality. If the test point
is a solution to the inequality, then the half-plane including that point should be shaded. If the test point is
not a solution to the inequality, then the
other half-plane should be shaded.
For example, suppose we had chosen
\((5, 0)\) as the test point in
Example 8.69. When we substitute its coordinates into the inequality, we find
\begin{equation*}
3(\alert{5}) - 2(\blert{0}) \lt 6
\end{equation*}
which is a
false statement. This tells us that
\((5, 0)\) is not a solution to the inequality, so the solutions must lie on the other side of the boundary line. Using
\((5, 0)\) as the test point gives us the same solutions we found in
Example 8.69.
Checkpoint 8.70 QuickCheck 2.
Which point would not be a good test point for the inequality
\(y \le \dfrac{2x}{3}\) ?
-
-
-
-
\(\displaystyle (-1,-1)\)
Here is a summary of our test point method for graphing inequalities.
To Graph an Inequality Using a Test Point:.
-
Graph the corresponding equation to obtain the boundary line.
-
Choose a test point that does not lie on the boundary line.
-
Substitute the coordinates of the test point into the inequality.
-
If the resulting statement is true, shade the half-plane that includes the test point.
-
If the resulting statement is false, shade the half-plane that does not include the test point.
-
If the inequality is strict, make the boundary line a dashed line.
Checkpoint 8.71 Practice 2.
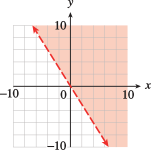
Graph the solutions of the inequality \(y \gt \dfrac{-3}{2}x\)
-
Graph the line
\(y = \dfrac{-3}{2}x\text{.}\) (Use the slope-intercept method.)
-
Choose a test point. (Do not choose
\((0, 0)\text{!}\))
-
Decide which side of the line to shade.
-
Should the boundary line be dashed or solid?
Recall that the equation of a vertical line has the form
\begin{equation*}
x=k
\end{equation*}
where \(k\) is a constant, and a horizontal line has an equation of the form
\begin{equation*}
y=k
\end{equation*}
Similarly, the inequality \(x\ge k\) may represent the inequality in two variables
\begin{equation*}
x+0y\ge k
\end{equation*}
Its graph is then a region in the plane.
Example 8.72.
Graph
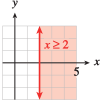
\(~~x\ge 2~~\) in the plane.
Solution.
First, we graph the equation \(x = 2\text{;}\) its graph is a vertical line. Because the origin does not lie on this line, we can use it as a test point. Substitute \(0\) for \(x\) (there is no \(y\)) into the inequality to obtain
\begin{equation*}
0\ge 2
\end{equation*}
Since this is a false statement, we shade the half-plane that does not contain the origin. We see in the figure below that the graph of the inequality contains all points whose \(x\)-coordinates are greater than or equal to \(2\text{.}\)
Checkpoint 8.73 Practice 3.
Graph
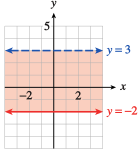
\(~~-2 \le y \lt 3~~\) in the plane.