Chapter 4 Applications of Quadratic Models

An important part of modeling is optimization, finding the best possible solution to a particular problem. For qudaratic models, this often involves finding the vertex of the graph where the maximum or minumum value of the output variable occurs.
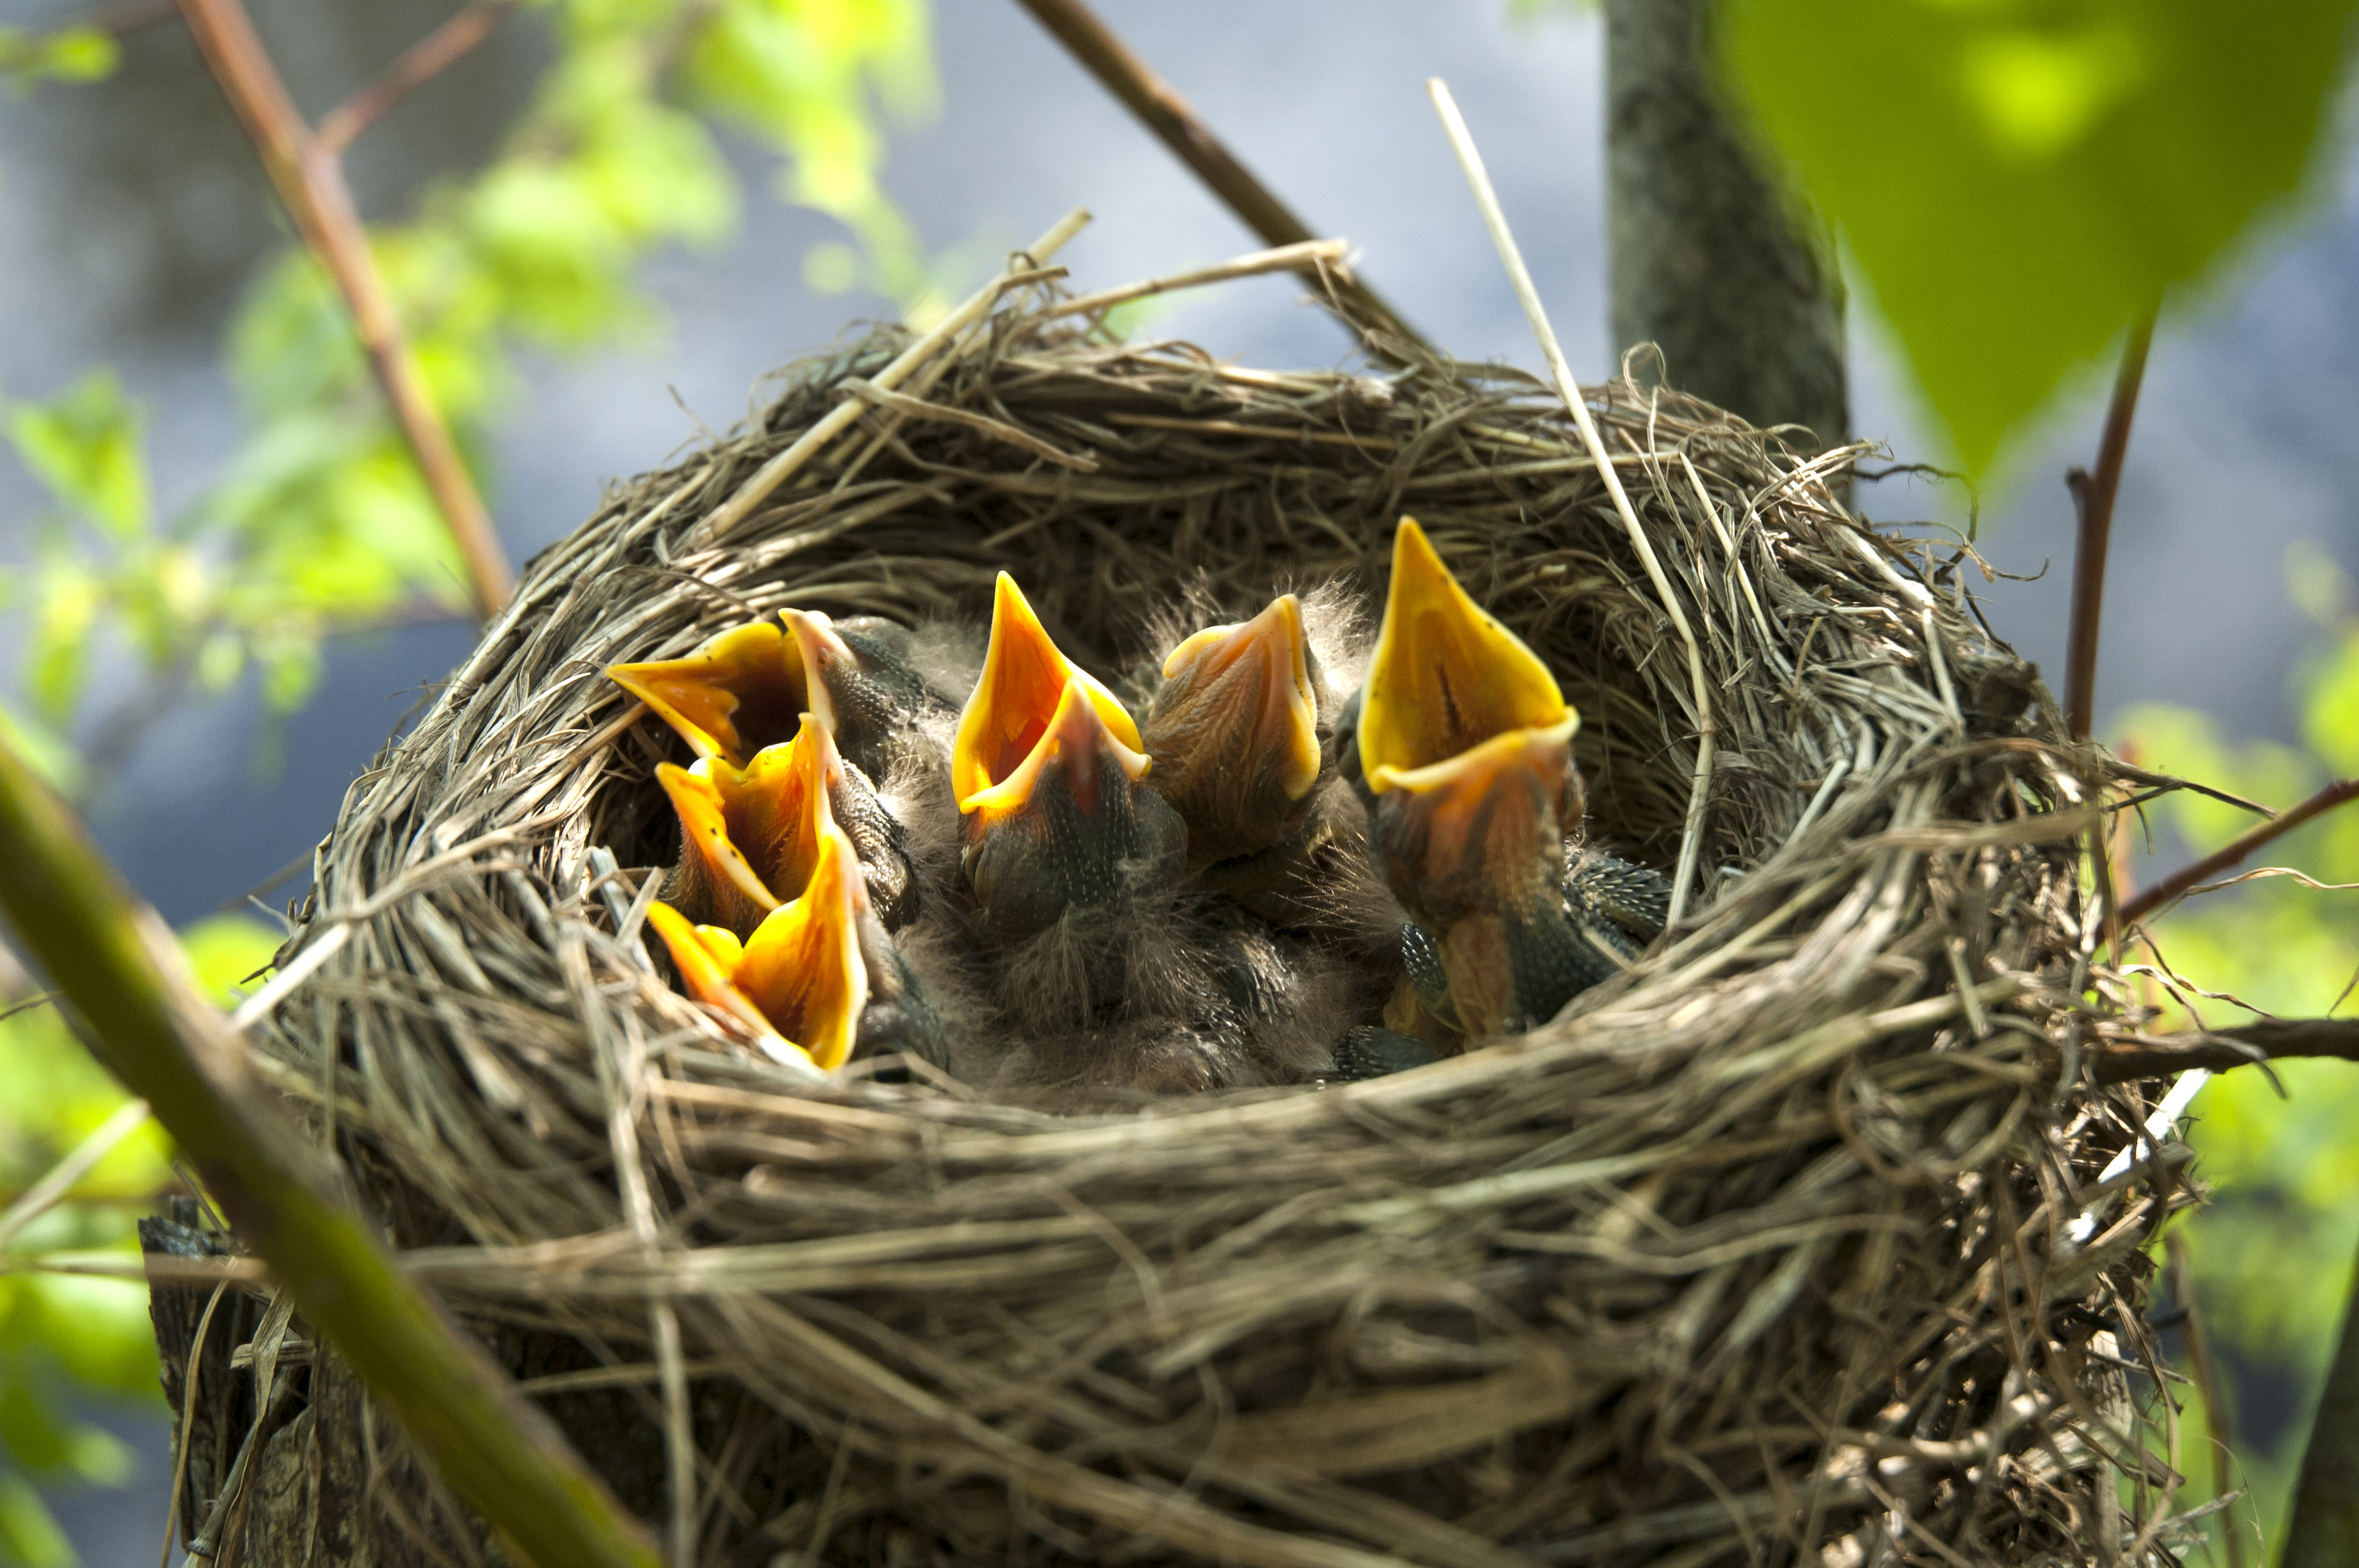
For example, biologists conducted a four-year study of the nesting habits of a species of wrens, The bar graph shows the clutch size (the number of eggs) in 433 nests. Why is 8 or 9 eggs the most common clutch size? Does that number increase the birds’ chances of survival?
The average weight of the young birds decrreases as the size of the brood increases, and the survival of individual nestlings is linked to their weight. Which clutch size produces the largest average number of survivors?
The graph shows the number of survivors for each clutch size in the study, along with the curve of best fit. The equation for the curve is \(y=-0.0105x^2+0.2x - 0.035\text{.}\) Looking at the graph, the optimum clutch size for maximizing the survival of the nestlings is about 9 eggs. How does this optimum clutch size compare with the most frequently observed clutch size in the study?

