Skip to main content
Contents
Search Book
Search Results:
No results.
Calculator
Readability settings Prev Up Next Scratch ActiveCode Profile title here \(\newcommand{\Volume}{\mathrm{Volume}}
\newcommand{\xLow}{\mathrm{xLow}}
\newcommand{\xHigh}{\mathrm{xHigh}}
\newcommand{\Mcost}{\operatorname{Marginal Cost}}
\newcommand{\cost}{\operatorname{Cost}}
\newcommand{\Mrev}{\operatorname{Marginal Revenue}}
\newcommand{\revenue}{\operatorname{Revenue}}
\newcommand{\profit}{\operatorname{Profit}}
\newcommand{\Mprofit}{\operatorname{Marginal Profit}}
\newcommand{\Pprofit}{\operatorname{Predicted Profit}}
\newcommand{\price}{\operatorname{Price}}
\newcommand{\Dprice}{\operatorname{Demand Price}}
\newcommand{\Pprice}{\operatorname{Purchase Price}}
\newcommand{\Sprice}{\operatorname{Supply Price}}
\newcommand{\marginal}{\operatorname{Marginal}\,}
\newcommand{\linear}{\operatorname{Linear}\,}
\newcommand{\abs}[1]{\left\lvert #1\right\rvert}
\newcommand{\quantity}{\mathrm{Quantity}}
\newcommand{\AnnualCost}{\operatorname{Annual Cost}}
\newcommand{\AnnualExpense}{\operatorname{Annual Expense}}
\newcommand{\RepairFactor}{\mathrm{Repair Factor}}
\newcommand{\Sales}{\operatorname{Sales}}
\newcommand{\prediction}{\operatorname{prediction}}
\newcommand{\FutureValue}{\operatorname{Future Value}}
\newcommand{\demand}{\operatorname{Demand}}
\newcommand{\val}{\operatorname{Value}}
\newcommand{\raw}{\mathrm{raw}}
\newcommand{\gizmos}{\operatorname{gizmos}}
\newcommand{\intermediate}{\mathrm{intermediate}}
\newcommand{\tax}{\operatorname{tax}}
\newcommand{\FaceValue}{\operatorname{Face Value}}
\newcommand{\rate}{\mathrm{rate}}
\newcommand{\years}{\mathrm{years}}
\newcommand{\expense}{\operatorname{expense}}
\newcommand{\FutureAmount}{\operatorname{FutureAmount}}
\newcommand{\InitialDeposit}{\mathrm{InitialDeposit}}
\newcommand{\ppy}{\mathrm{ppy}}
\newcommand{\PresentAmount}{\operatorname{PresentAmount}}
\newcommand{\PriceGizmo}{\mathrm{PriceGizmos}}
\newcommand{\QuantityGizmo}{\mathrm{QuantityGizmos}}
\newcommand{\QuantityGadget}{\mathrm{QuantityGadgets}}
\newcommand{\QuantityWidget}{\mathrm{QuantityWidgets}}
\newcommand{\PriceWidget}{\mathrm{PriceWidgets}}
\newcommand{\PriceGadget}{\mathrm{PriceGadgets}}
\newcommand{\QW}{\mathrm{QW}}
\newcommand{\QG}{\mathrm{QG}}
\newcommand{\PW}{\mathrm{PW}}
\newcommand{\PG}{\mathrm{PG}}
\newcommand{\Production}{\operatorname{Production}}
\newcommand{\Labor}{\mathrm{Labor}}
\newcommand{\Capital}{\mathrm{Capital}}
\newcommand{\Linear}{\operatorname{Linear}\,}
\newcommand{\PriceX}{\mathrm{PriceX}}
\newcommand{\PriceY}{\mathrm{PriceY}}
\newcommand{\predicted}{\operatorname{predicted}}
\newcommand{\Time}{\mathrm{time}}
\newcommand{\TotalAmount}{\operatorname{TotalAmount}}
\newcommand{\TotalValue}{\operatorname{TotalValue}}
\newcommand{\CashAmount}{\mathrm{CashAmount}}
\newcommand{\DepositAmount}{\mathrm{DepositAmount}}
\newcommand{\AvailableTrees}{\operatorname{AvailableTrees}}
\newcommand{\Capacity}{\mathrm{Capacity}}
\newcommand{\Amount}{\operatorname{Amount}}
\newcommand{\InitialAmount}{\mathrm{InitialAmount}}
\newcommand{\InvestmentAmount}{\mathrm{InvestmentAmount}}
\newcommand{\Return}{\operatorname{Return}}
\newcommand{\SD}{\mathrm{SD}}
\newcommand{\Antideriv}{\operatorname{Antideriv}}
\newcommand{\MC}{\operatorname{MC}}
\newcommand{\MP}{\operatorname{MP}}
\newcommand{\MR}{\operatorname{MR}}
\newcommand{\CDFf}{\operatorname{CDFf}}
\newcommand{\Principal}{\operatorname{Principal}}
\newcommand{\ProducerSurplus}{\mathrm{ProducerSurplus}}
\newcommand{\ConsumerSurplus}{\mathrm{ConsumerSurplus}}
\newcommand{\TotalSocialGain}{\mathrm{TotalSocialGain}}
\newcommand{\Elasticity}{\operatorname{Elasticity}}
\newcommand{\lt}{<}
\newcommand{\gt}{>}
\newcommand{\amp}{&}
\definecolor{fillinmathshade}{gray}{0.9}
\newcommand{\fillinmath}[1]{\mathchoice{\colorbox{fillinmathshade}{$\displaystyle \phantom{\,#1\,}$}}{\colorbox{fillinmathshade}{$\textstyle \phantom{\,#1\,}$}}{\colorbox{fillinmathshade}{$\scriptstyle \phantom{\,#1\,}$}}{\colorbox{fillinmathshade}{$\scriptscriptstyle\phantom{\,#1\,}$}}}
\)
Chapter 7 Integration
Suppose that for a given company the marginal cost has been determined to be
\begin{equation*}
\Mcost(x)=x^3+3x^2\text{.}
\end{equation*}
We would like to re-construct the cost function from this data. Suppose we also know that the fixed cost is equal to $100. How do we find out the cost for producing \(x\) items?
Start with the fixed cost.
Add the marginal cost for each consecutive item.
Create a running cost column to keep track of the cost as we accumulate the data.
For this example we would get:
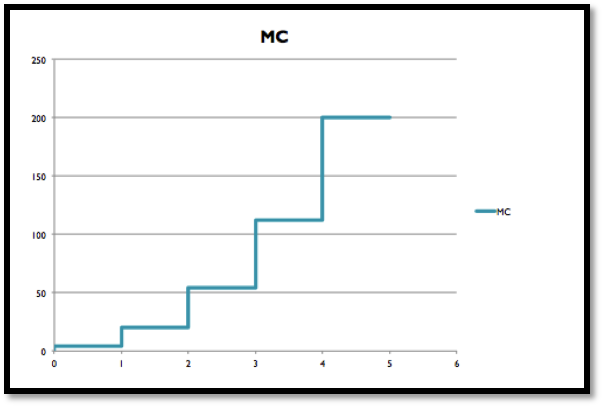
We would like to relate this data to the original graph of the marginal cost. When we consider this graph we see that the estimated cost actually corresponds to the area underneath the Marginal Cost function
\(\Mcost(x)\text{.}\)
In other words, the cost function is the accumulation of the derivative (the marginal cost). Graphically, the cost function corresponds to the area underneath the marginal cost function.
We want to consider the accumulation of continuous functions. In the language of calculus this is called finding an integral.