
Making Predictions with the Regression Line
Recall that in the section on regression lines, you learned about the equation for the regression line.
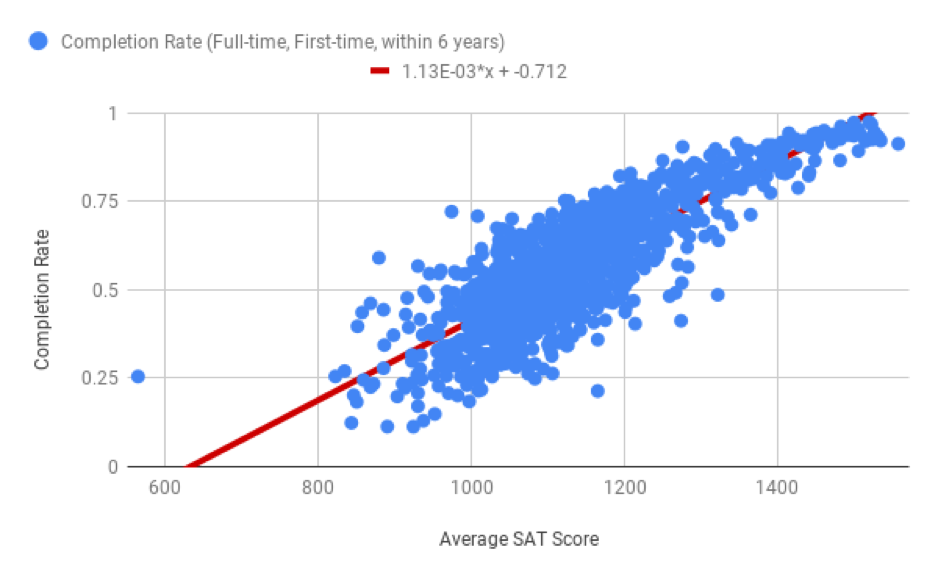
Returning to the scatter plot showing average SAT score and completion rate, the equation of the regression line is \(y = 0.0011x - 0.7116\). The slope is 0.0011 and the y-intercept is -0.7116. Another way to write this is to use the descriptions of the x and y variables.
\(\text{Predicted Completion Rate} = 0.0011 \times (\text{Average SAT Score}) - 0.7116\)
If you’re wondering why the equation in the graph above or in Sheets has an E in it, that’s called scientific notation. You can read more about scientific notation here.
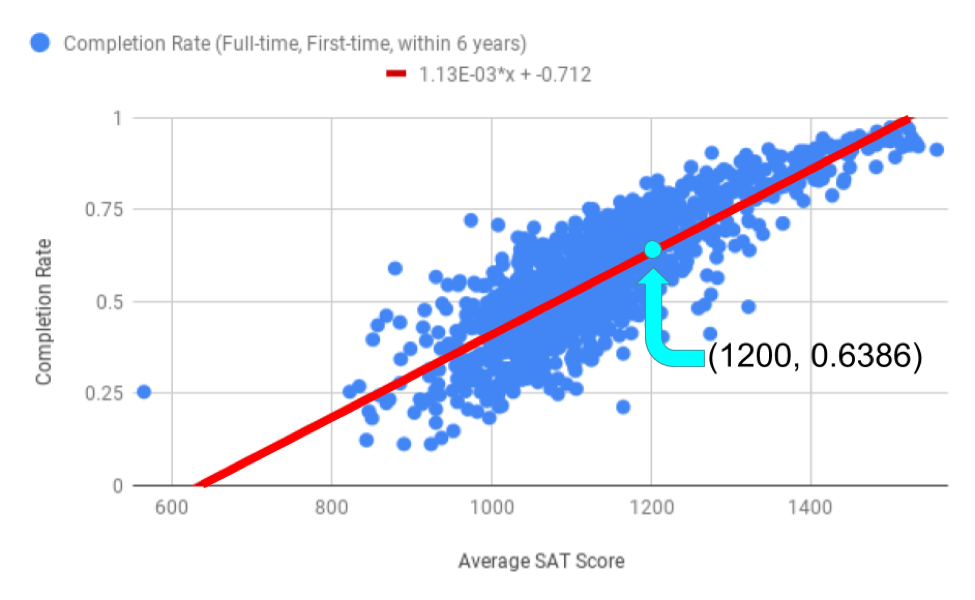
Suppose University X has an average SAT score of 1200 for incoming freshmen. You could use the graph to estimate the completion rate at University X, but depending on how carefully you read that graph, the estimates could vary. A much more precise way of making that estimate is to use the equation of the line. Because University X has an average SAT score of 1200, you will replace that portion of the regression line equation with the number 1200.
\(\text{Predicted Completion Rate} = 0.0011 \times (1200) - 0.7116 = 0.6386 \text{ (or } 63.86 \%)\)
So, University X has a predicted completion rate of 63.86%. The point (1200, 0.6386) is illustrated on the scatter plot below.
Q-1: Use the regression line to estimate the completion rate for a school with an average SAT score of 1400.
You can use the same method to estimate the completion rate for a school with an average SAT score of 600.
\(\text{Predicted Completion Rate} = 0.0011 \times (600) - 0.7116 = -0.0365 \text{ (or } -3.65 \%)\)
But a negative completion rate doesn’t make sense! A school can’t have a graduation rate lower than 0%. The reason this doesn’t make sense is because 600 is outside of the range of most of the data, and trying to predict outside of that range is extrapolation. Because there is only one school with an average SAT score that low, using this regression line is not going to give a reliable (or even reasonable) prediction. Finding regression lines and making predictions can be difficult with such outliers.