
Filtering Data
Sometimes, you want to look at an entire dataset. But at other times, you may also be interested in just a specific subset of a dataset. For example, if you have data on all of the USA, you may want to do data analysis on a specific state only.
Filters in Sheets
A filter is a way of selecting a subset of rows based on a set of column conditions. A “column condition” is a statement that restricts the value in a column.
For example, if column A contains two-letter state codes of the USA, and you
wanted to subset the dataset to only rows corresponding to California, the
condition on that column would be “=CA”.
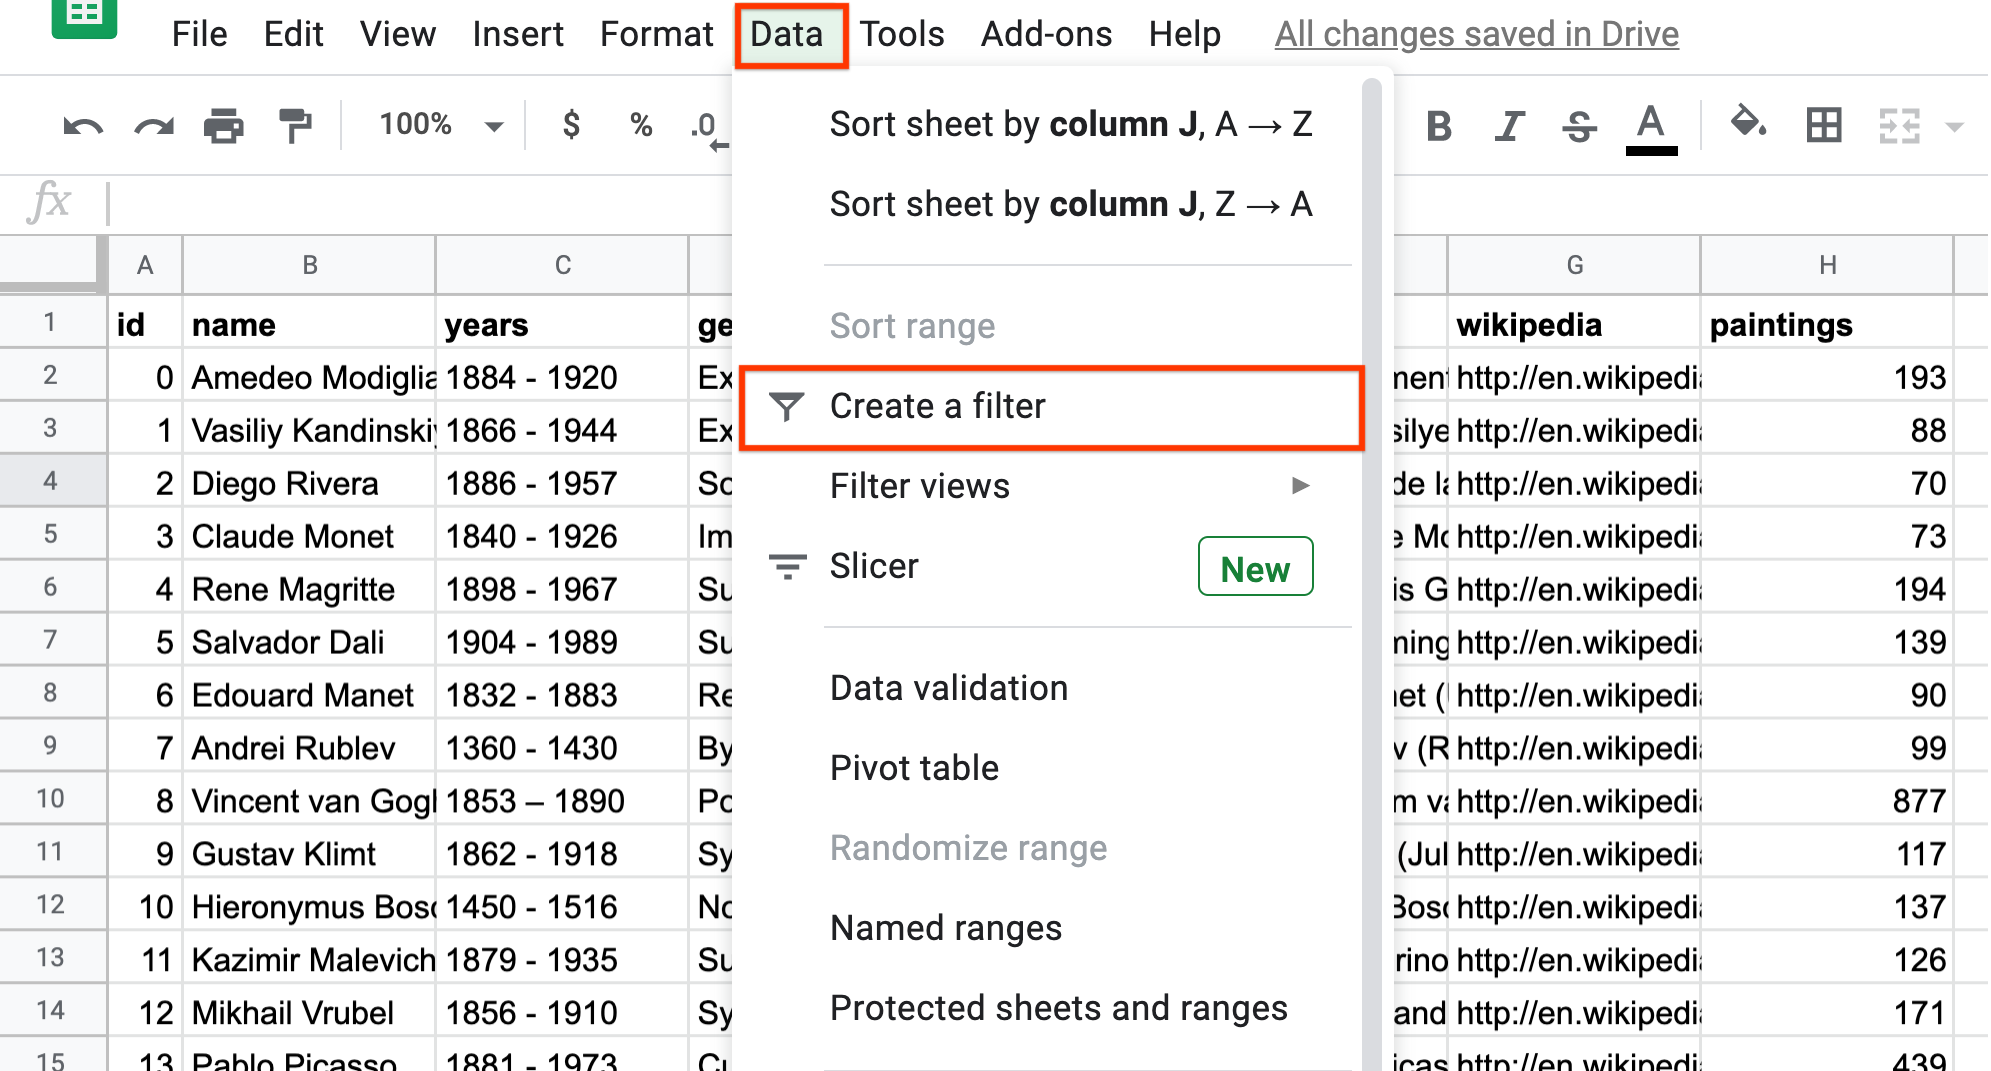
In Sheets, you can create a filter by clicking “Data > Create a filter”. This creates a filter, assuming row 1 contains column headers, for each column in the dataset. (Note that there is also a FILTER function in Sheets that you can use in formulas. This is discouraged, since using the formula is less intuitive than using the filter itself, and as such this section does not cover it.)
Example: Painters
A few chapters ago in this example, you used formulas to filter a dataset of painters down to show only French painters who had painted over 200 paintings. For simplicity, that example assumed that a painter was French if French was listed as their only nationality. This example illustrates how to recreate that solution using filters, and also extends the example to include French painters who also have other nationalities listed.
The first step is to add a filter to this dataset, by navigating to “Data > Create a filter”. Make sure that your cursor is clicked anywhere around the data that is to be filtered. In this example, it is anywhere in the range A1:H51.
You should now see that each column, in row 1, has a filter icon. Now, you can use this filter to filter down to rows where the nationality is French. First, click on the nationality filter icon. In this case, you are filtering by a value (an exact nationality). Pressing “Clear” removes all selections. You can then select “French”, either by scrolling through the values, or by typing “French”.
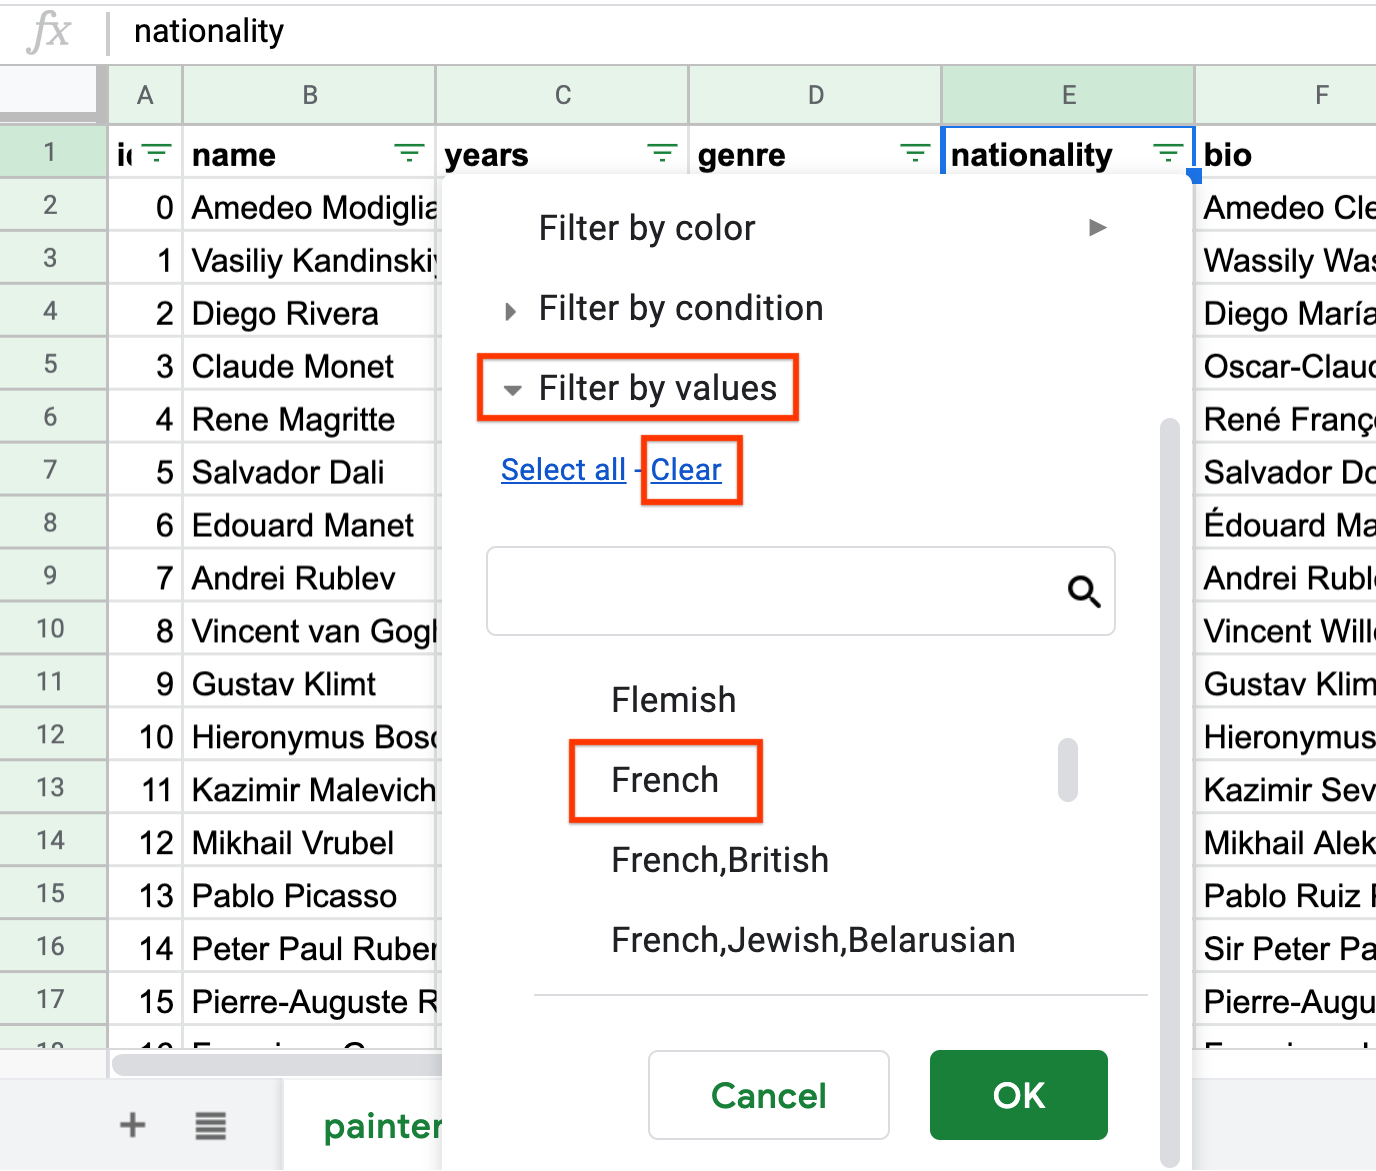
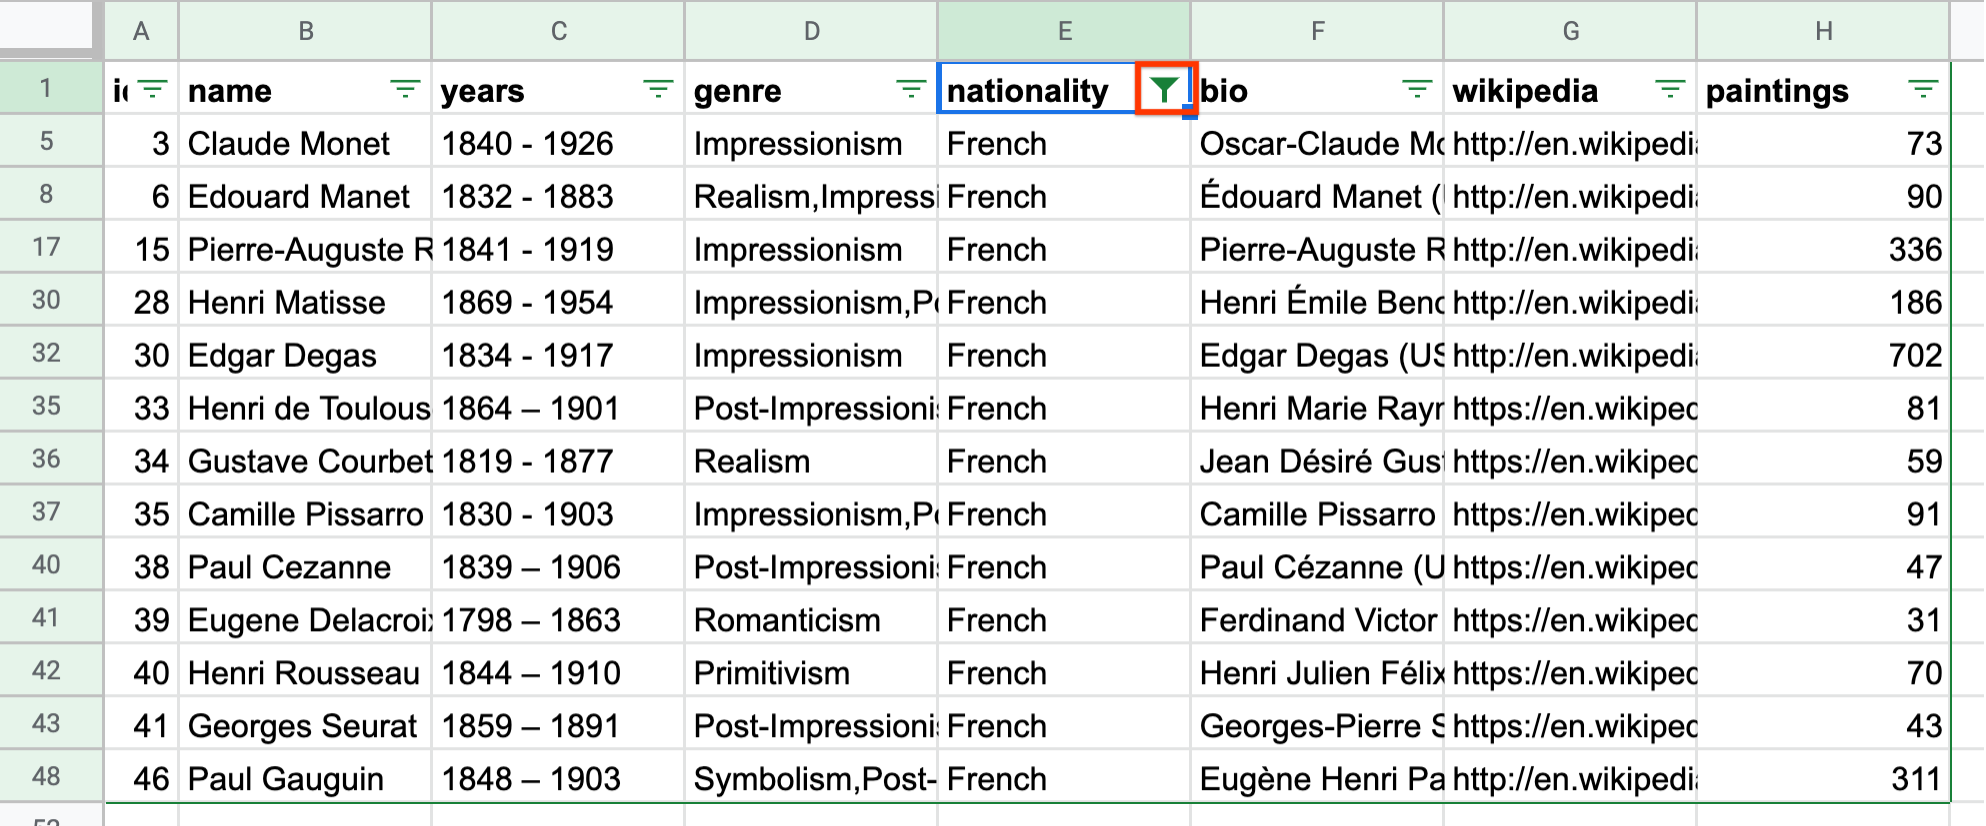
When you click “OK”, the result will be only French painters, and the nationality filter icon is now filled, rather than empty.
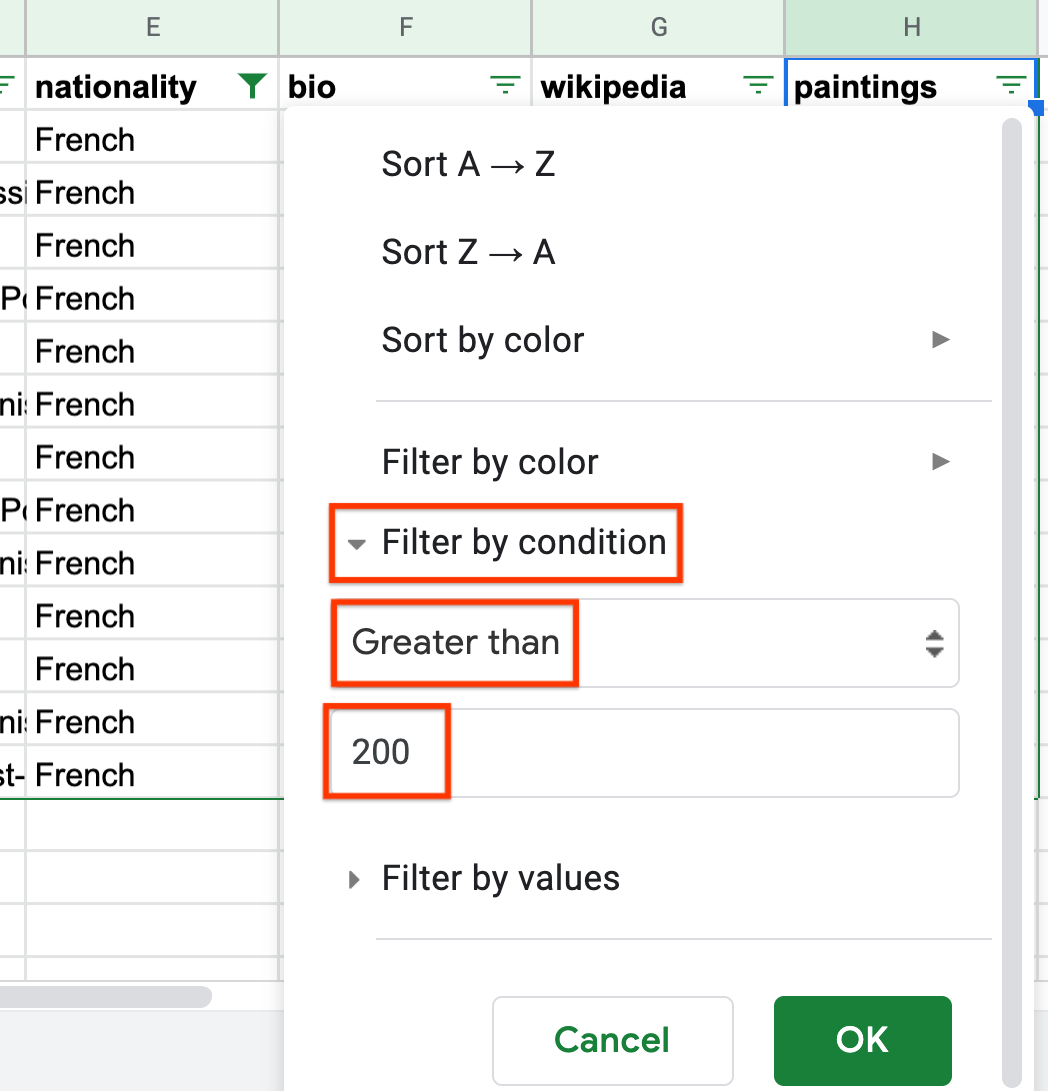
Now you can do the same for values of paintings greater than 200. In this case, you are filtering by a condition, the condition that the number of paintings is greater than 200. This is different than filtering by a value, for example, if you were filtering for when number of paintings is equal to 200.
So within the filter box, you should select “Filter by condition”, scroll to “Greater than”, and type 200. This creates a filter conditioning on the number of paintings being greater than 200.
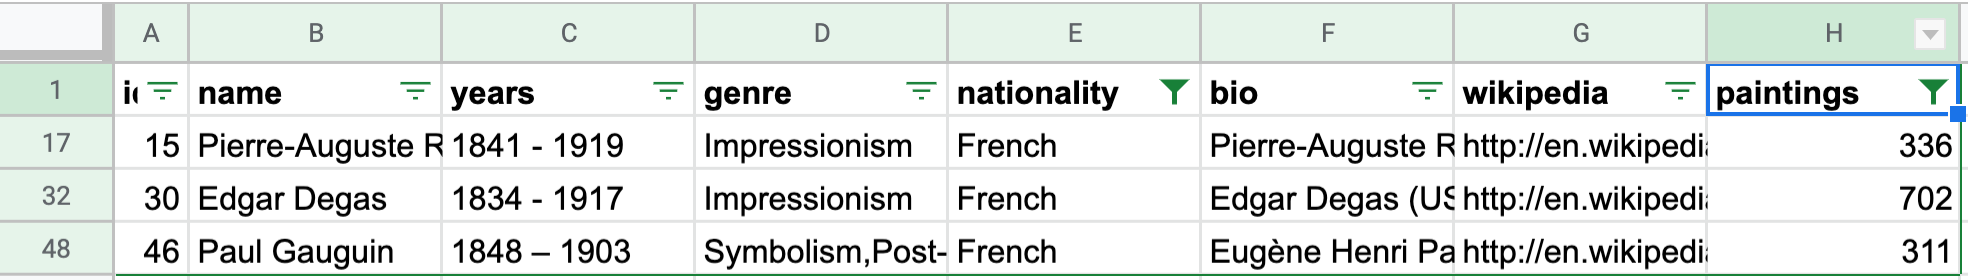
Once this is done, the green filter icon should be filled, and you should see only three rows left. Specifically, the same three painters found using formulas in the previous example: Renoir, Degas, and Gauguin.
Raphael
-
Incorrect
Caravaggio
-
Correct
Michelangelo
-
Correct
Eugene Delacroix
-
Incorrect
Q-1: Filter this dataset to find all Italian (exclusively Italian) painters who painted fewer than 100 paintings.
Filters make this kind of exercise significantly easier. What was previously a complicated formula is now just two simple filters. Moreover, filters allow you to be more specific with your conditions, which makes them a powerful but easy tool to use. Suppose, instead of looking at painters who only have French nationality, you now want to look at painters for whom at least one of their nationalities is French. (For example, this includes Alfred Sisley, whose nationalities are French and British.)
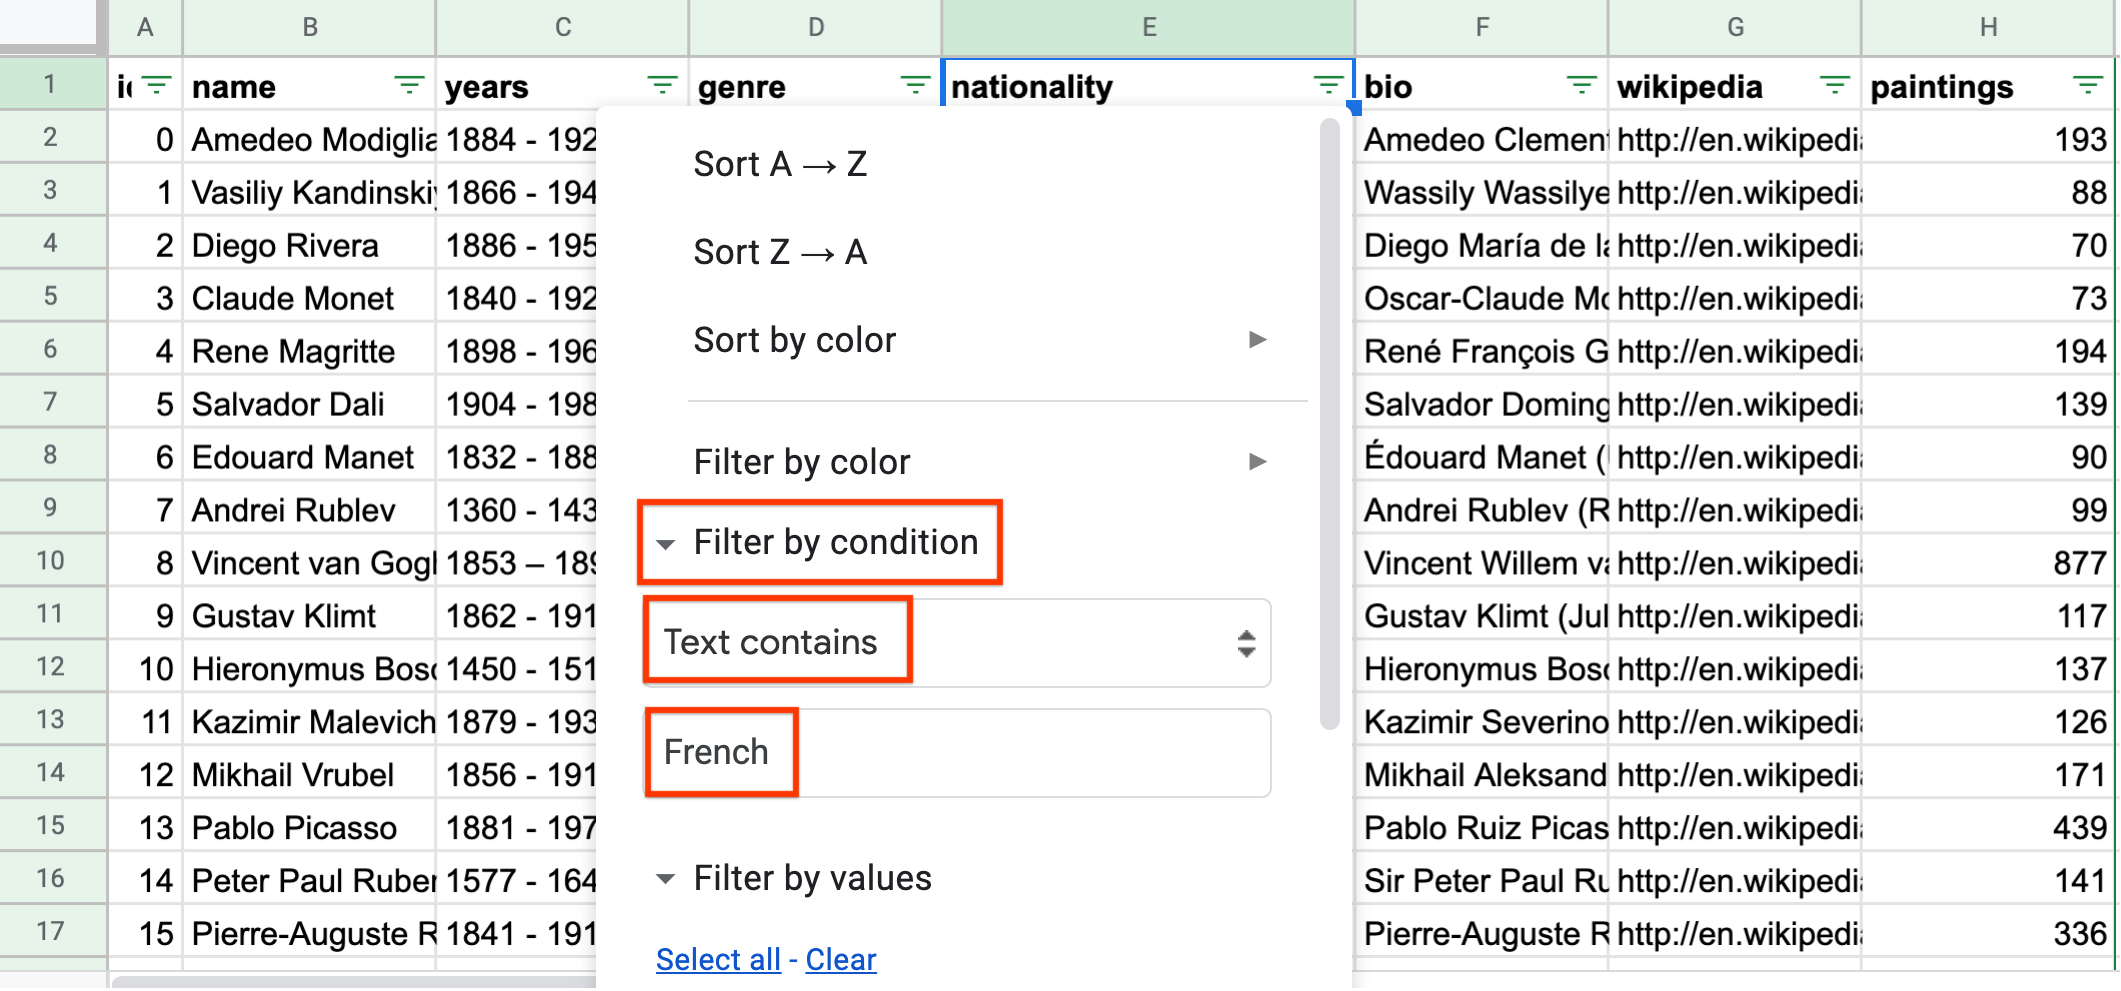
Since this filter is not based on an exact equality, you need to use a “Filter by condition”. You can change the filter applied to the “nationality” column, from a “Filter on values” to a “Filter on condition”. You can scroll to “Text contains”, then type the word “French”.
Q-2: Find the only two painters associated with any form of Impressionism (including Post-Impressionism), but who do not have French listed as a nationality. (Write the full names as spelled in the sheet. Use the order of the ID in the sheet.) (Hint: Use “Text (does not) contain(s)” under “Filter by condition”.) and
Sorting Data
Now you will see how a Filter in Sheets can also be used to easily sort data.
Data is often unordered, which can make it difficult to examine visually. Sorting data allows you to order columns. Most of the ordering you will come across is either numeric or text.
Numeric data can be ordered “lowest to highest” or “highest to lowest”.
Text data can be ordered alphabetically “A-Z” or “Z-A”.
Sorting can be useful if you just want to see the top or bottom values of a dataset. For example, if you have a list of bills you need to pay this month, you can order it by total amount owed to see the cost of the most expensive and least expensive bill you have to pay.
If you have already set up a Filter in Sheets, sorting comes for free. For example, suppose you wanted to sort the painters dataset alphabetically by genre.
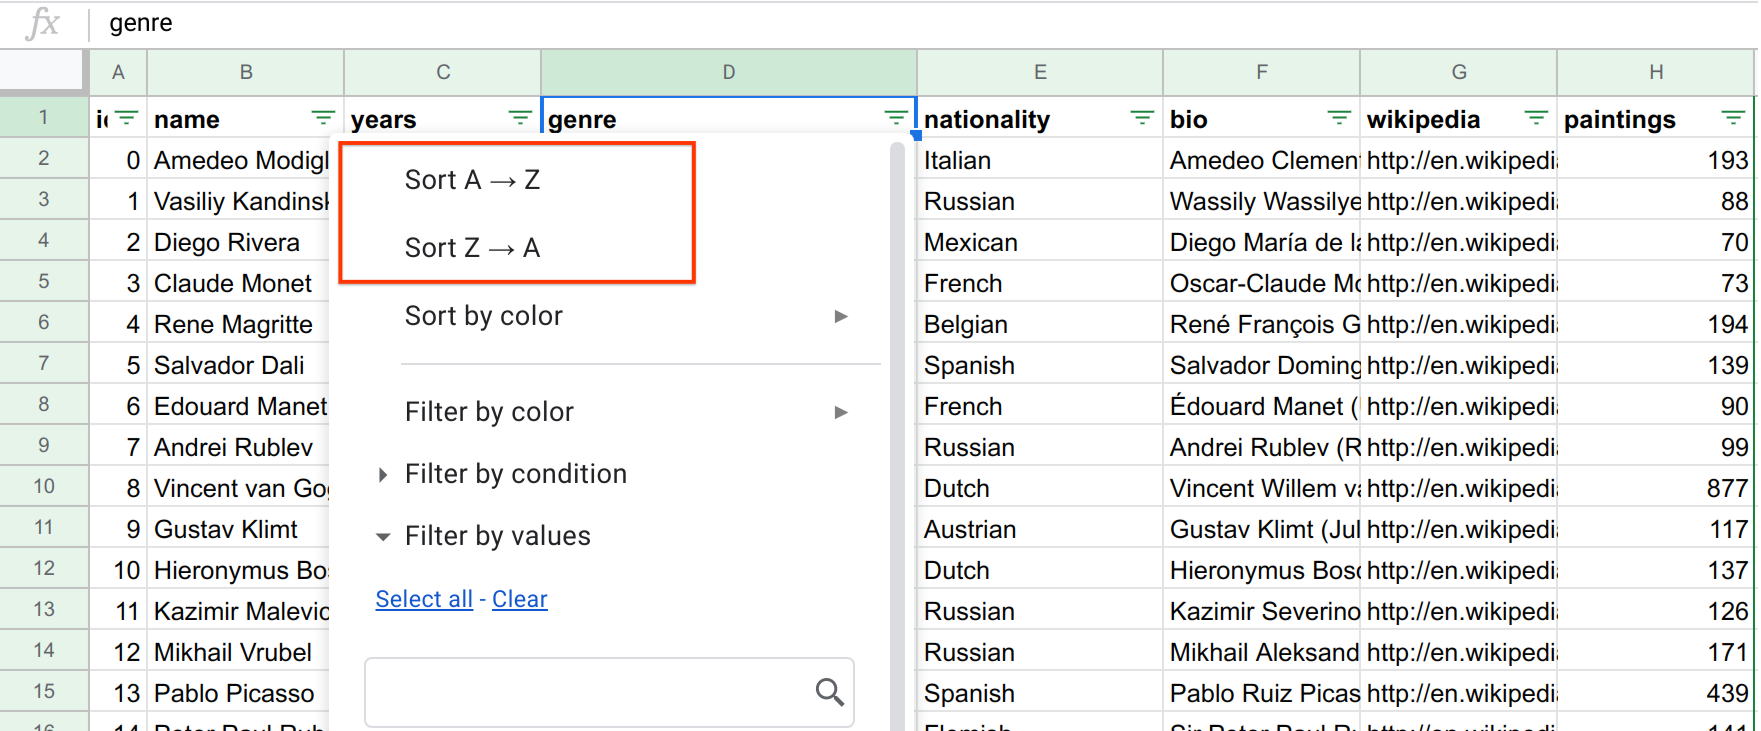
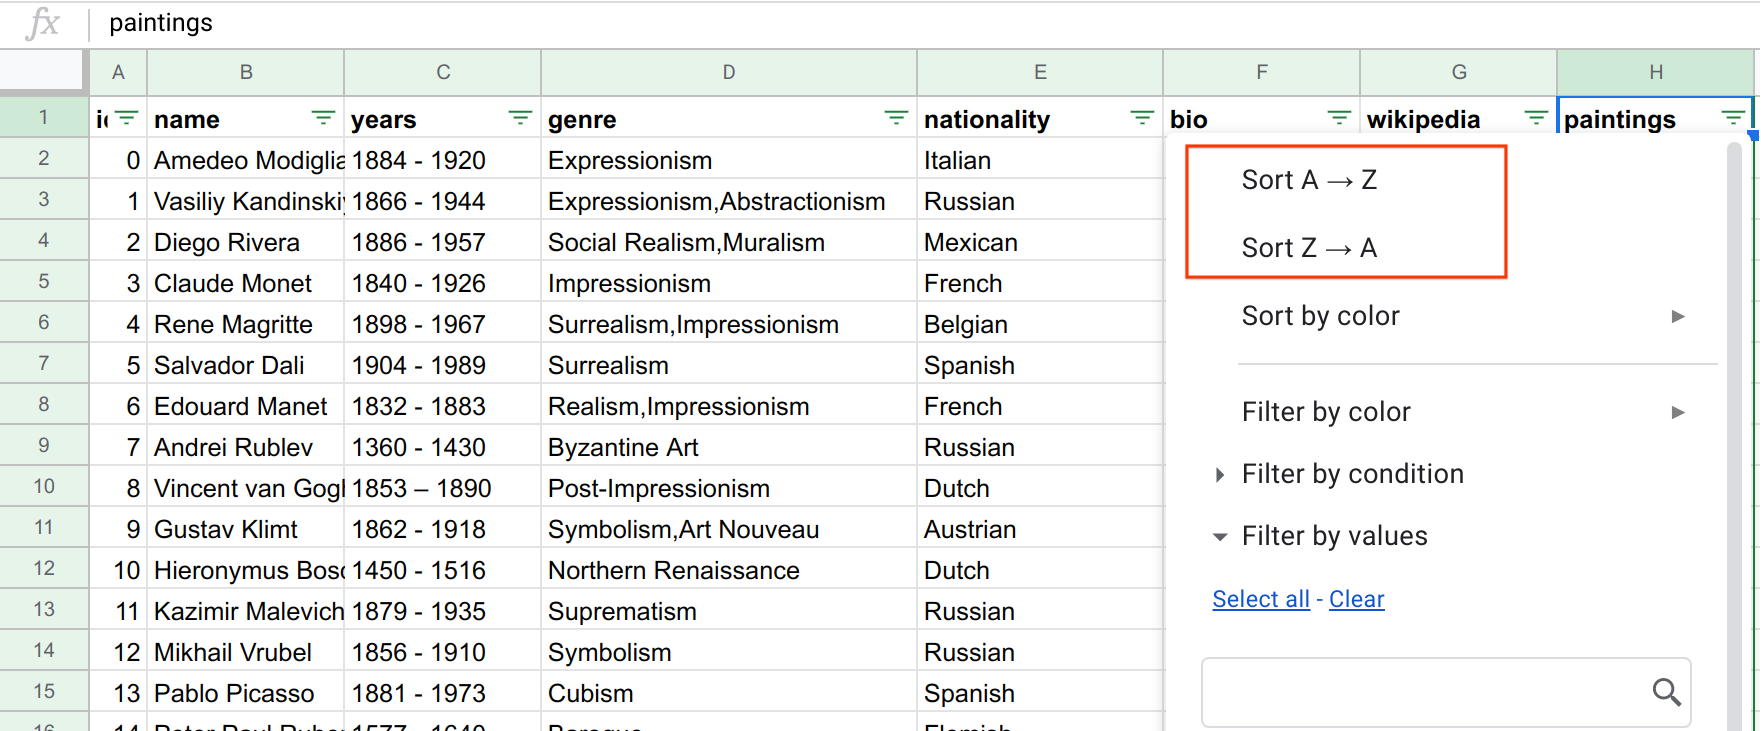
Note that you can sort “A-Z” or “Z-A”. If you try to sort a numeric column, you will see the same options (“A-Z” or “Z-A”), but these will act as numeric sorters, and denote “lowest to highest” and “highest to lowest” respectively.
Q-3: Which painter was born the earliest? (Enter the painter’s name as it appears in the spreadsheet.)
Q-4: Which of the painters whose first names start with A painted the fewest paintings? Hint: You may need to create a new table with a new filter. (Enter the painter’s name as it appears in the spreadsheet.)