
6.2. Case Study 1: Exploratory Data Analysis
6.2.1. Loading Data into a DataFrame from a CSV File
The CSV file is one of the most common ways you will find data. CSV stands for “comma separated value”, and this format allows us to share data files in a simple text format. The data we will use to get started with Pandas is the data about countries we used in the spreadsheet module. You can open a CSV file in any text editor, but it may not be particularly easy to read. But because of its structure, it is easy to parse for analysis. The first few lines of the raw CSV file for this project look like this.
Country,Ctry,Code,CodeNum,Region,Population,Area,Pop. Density,Coastline,Net migration,Infant mortality,GDP,Literacy,Phones,Arable,Crops,Other,Climate,Birthrate,Deathrate,Agriculture,Industry,Service
Afghanistan,Afghanistan,AFG,4,ASIA (EX. NEAR EAST)         ,31056997,647500,48.0,0.00,23.06,163.07,700,36.0,3.2,12.13,0.22,87.65,1,46.6,20.34,0.38,0.24,0.38
Albania ,Albania,ALB,8,EASTERN EUROPE                     ,3581655,28748,124.6,1.26,-4.93,21.52,4500,86.5,71.2,21.09,4.42,74.49,3,15.11,5.22,0.232,0.188,0.579
Algeria ,Algeria,DZA,12,NORTHERN AFRICA                    ,32930091,2381740,13.8,0.04,-0.39,31,6000,70.0,78.1,3.22,0.25,96.53,1,17.14,4.61,0.101,0.6,0.298
You may have some experience with reading and parsing CSV files on your own with Python. If not don’t worry. If you are interested in learning more, you may wish to review this material.
%matplotlib inline

import pandas as pd
import matplotlib
import matplotlib.pyplot as plt
import psycopg2
import seaborn as sbn
from altair import Chart, X, Y, Color, Scale
import altair as alt
from vega_datasets import data
import requests
from bs4 import BeautifulSoup
matplotlib.style.use('ggplot')
# for plotly py.offline.init_notebook_mode()
Meanwhile, we will make use of one of the many data reading functions Pandas
provides for us, read_csv.
wd = pd.read_csv('world_countries.csv')
wd.head()
| Country | Ct | Code | CodeNum | Region | Population | Area | Pop. Density | Coastline | Net migration | ... | Phones | Arable | Crops | Other | Climate | Birthrate | Deathrate | Agriculture | Industry | Service | |
|---|---|---|---|---|---|---|---|---|---|---|---|---|---|---|---|---|---|---|---|---|---|
| 0 | Afghanistan | Afghanistan | AFG | 4 | ASIA (EX. NEAR EAST) | 31056997 | 647500 | 48.0 | 0.00 | 23.06 | ... | 3.2 | 12.13 | 0.22 | 87.65 | 1.0 | 46.60 | 20.34 | 0.380 | 0.240 | 0.380 |
| 1 | Albania | Albania | ALB | 8 | EASTERN EUROPE | 3581655 | 28748 | 124.6 | 1.26 | -4.93 | ... | 71.2 | 21.09 | 4.42 | 74.49 | 3.0 | 15.11 | 5.22 | 0.232 | 0.188 | 0.579 |
| 2 | Algeria | Algeria | DZA | 12 | NORTHERN AFRICA | 32930091 | 2381740 | 13.8 | 0.04 | -0.39 | ... | 78.1 | 3.22 | 0.25 | 96.53 | 1.0 | 17.14 | 4.61 | 0.101 | 0.600 | 0.298 |
| 3 | American Samoa | American Samoa | ASM | 16 | OCEANIA | 57794 | 199 | 290.4 | 58.29 | -20.71 | ... | 259.5 | 10.00 | 15.00 | 75.00 | 2.0 | 22.46 | 3.27 | NaN | NaN | NaN |
| 4 | Andorra | Andorra | AND | 20 | WESTERN EUROPE | 71201 | 468 | 152.1 | 0.00 | 6.60 | ... | 497.2 | 2.22 | 0.00 | 97.78 | 3.0 | 8.71 | 6.25 | NaN | NaN | NaN |
5 rows × 23 columns
6.2.2. Describing the Data
Country
Area square miles
Population density per square mile
Coastline coast/area ratio
Net migration
Infant mortality per 1000 births
GDP $ per capita
Literacy %
Phones per 1000
Arable land %
Crops %
Other %
Climate
Birthrate
Deathrate
Agriculture % GDP
Industry % GDP
Service % GDP
The climate numbers are as follows.
Dry tropical or tundra and ice
Wet tropical
Temperate humid subtropical and temperate continental
Dry hot summers and wet winters
Somehow, some values of 1.5 and 2.5 have crept in, so we will assume that 1.5 is mixed between 1 and 2, and 2.5 mixed between 2 and 3.
wd.describe()
| CodeNum | Population | Area | Pop. Density | Coastline | Net migration | Infant mortality | GDP | Literacy | Phones | Arable | Crops | Other | Climate | Birthrate | Deathrate | Agriculture | Industry | Service | |
|---|---|---|---|---|---|---|---|---|---|---|---|---|---|---|---|---|---|---|---|
| count | 225.000000 | 2.250000e+02 | 2.250000e+02 | 225.000000 | 225.000000 | 222.000000 | 222.000000 | 224.000000 | 209.000000 | 221.000000 | 223.000000 | 223.000000 | 223.000000 | 203.000000 | 222.000000 | 221.000000 | 210.000000 | 209.000000 | 210.000000 |
| mean | 436.213333 | 2.897847e+07 | 6.035169e+05 | 362.911111 | 21.304089 | 0.017838 | 35.635180 | 9770.089286 | 82.838278 | 236.435294 | 13.715247 | 4.425695 | 81.858700 | 2.130542 | 21.993604 | 9.290045 | 0.151710 | 0.282722 | 0.564395 |
| std | 254.713527 | 1.183891e+08 | 1.797370e+06 | 1650.160243 | 72.591840 | 4.906187 | 35.523302 | 10057.808157 | 19.722173 | 228.942889 | 13.057554 | 8.268356 | 16.029195 | 0.697558 | 11.147278 | 4.986086 | 0.147199 | 0.138935 | 0.166357 |
| min | 4.000000 | 7.026000e+03 | 2.000000e+00 | 0.000000 | 0.000000 | -20.990000 | 2.290000 | 500.000000 | 17.600000 | 0.200000 | 0.000000 | 0.000000 | 33.330000 | 1.000000 | 7.290000 | 2.290000 | 0.000000 | 0.020000 | 0.062000 |
| 25% | 214.000000 | 4.361310e+05 | 5.128000e+03 | 29.000000 | 0.100000 | -0.962500 | 8.070000 | 1900.000000 | 70.600000 | 37.200000 | 3.160000 | 0.190000 | 72.825000 | 2.000000 | 12.597500 | 5.980000 | 0.038000 | 0.190000 | 0.427750 |
| 50% | 434.000000 | 5.042920e+06 | 8.836100e+04 | 77.400000 | 0.730000 | 0.000000 | 21.000000 | 5700.000000 | 92.500000 | 176.200000 | 10.380000 | 1.010000 | 86.070000 | 2.000000 | 18.750000 | 8.100000 | 0.099500 | 0.270000 | 0.566500 |
| 75% | 654.000000 | 1.765484e+07 | 4.465500e+05 | 183.500000 | 10.320000 | 0.965000 | 56.095000 | 15775.000000 | 98.000000 | 394.400000 | 20.000000 | 4.425000 | 95.470000 | 3.000000 | 29.645000 | 10.620000 | 0.223000 | 0.342000 | 0.677500 |
| max | 894.000000 | 1.313974e+09 | 1.707520e+07 | 16271.500000 | 870.660000 | 23.060000 | 191.190000 | 55100.000000 | 100.000000 | 1035.600000 | 62.110000 | 50.680000 | 100.000000 | 4.000000 | 50.730000 | 29.740000 | 0.769000 | 0.906000 | 0.954000 |
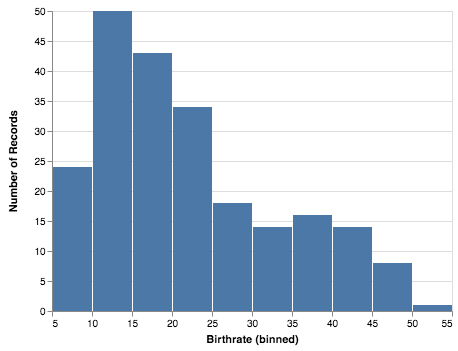
6.2.3. Visualizing Distribution with Histograms
c = Chart(wd) # make a chart
m = c.mark_bar() # set the mark -- returns a new Chart
e = m.encode(X('Birthrate',bin=True),y='count()') # set the encoding
e.display()

We can shortcut a lot of what we did above into a single line, because once we have created a mark, there is really nothing more to do with it besides to add the encoding. Because the methods are all cleverly designed to return the proper object, we can string all of the calls above into a single line. We also do not need to explicitly call “display”, because Altair returns an object that the Jupyter environment knows how to display automatically.
Chart(wd).mark_bar().encode(x=X('Birthrate', bin=True), y='count()')
6.2.4. Practice
Q-1: What is the range of values for the tallest bar when creating a histogram of the literacy rate? Lower: Upper:
Q-2: What is the range of values for the tallest bar when creating a histogram of the fraction of the economy due to service? Lower: Upper:
Q-3: Approximately how many countries (to the nearest 5) have between 90% and 100% of their economy based on service?
6.2.5. Scatter Plots for Discovering Relationships
Now, let’s make a simple scatter plot of area versus population of the countries.
Chart(wd).mark_point().encode(x='Population', y='Area', tooltip='Country')
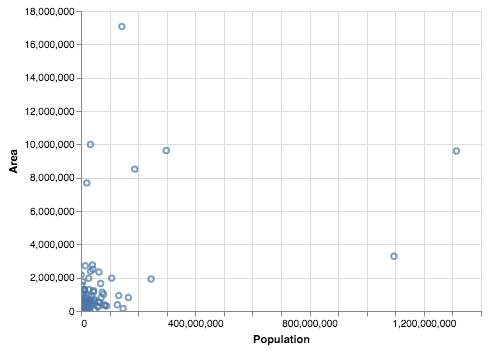
That’s not a very satisfying graph, but it does make us want to focus more on the lower left corner. Let’s redo the graph focussing on the countries with a population under 150 million and an area under million. Let’s start with the first part.
To do this, we will create a new DataFrame where we focus on the countries with populations less than 150 million and areas less than 4 million. Pandas make this really easy with its querying power.
The statement below produces a Series of boolean values. These boolean values are used to index the data frame, and only the rows corresponding to True values are returned in the result.
(wd.Population < 150000000).head(20)
0     True
1     True
2     True
3     True
4     True
5     True
6     True
7     True
8     True
9     True
10    True
11    True
12    True
13    True
14    True
15    True
16    True
17    True
18    True
19    True
Name: Population, dtype: bool
To be a bit more dramatic, let’s look at the countries of less than 150,000.
wd[wd.Population < 150000]
| Country | Ct | Code | CodeNum | Region | Population | Area | Pop. Density | Coastline | Net migration | ... | Phones | Arable | Crops | Other | Climate | Birthrate | Deathrate | Agriculture | Industry | Service | |
|---|---|---|---|---|---|---|---|---|---|---|---|---|---|---|---|---|---|---|---|---|---|
| 3 | American Samoa | American Samoa | ASM | 16 | OCEANIA | 57794 | 199 | 290.4 | 58.29 | -20.71 | ... | 259.5 | 10.00 | 15.00 | 75.00 | 2.0 | 22.46 | 3.27 | NaN | NaN | NaN |
| 4 | Andorra | Andorra | AND | 20 | WESTERN EUROPE | 71201 | 468 | 152.1 | 0.00 | 6.60 | ... | 497.2 | 2.22 | 0.00 | 97.78 | 3.0 | 8.71 | 6.25 | NaN | NaN | NaN |
| 6 | Anguilla | Anguilla | AIA | 660 | LATIN AMER. & CARIB | 13477 | 102 | 132.1 | 59.80 | 10.76 | ... | 460.0 | 0.00 | 0.00 | 100.00 | 2.0 | 14.17 | 5.34 | 0.040 | 0.180 | 0.780 |
| 7 | Antigua & Barbuda | Antigua & Barbuda | ATA | 10 | LATIN AMER. & CARIB | 69108 | 443 | 156.0 | 34.54 | -6.15 | ... | 549.9 | 18.18 | 4.55 | 77.27 | 2.0 | 16.93 | 5.37 | 0.038 | 0.220 | 0.743 |
| 10 | Aruba | Aruba | ABW | 533 | LATIN AMER. & CARIB | 71891 | 193 | 372.5 | 35.49 | 0.00 | ... | 516.1 | 10.53 | 0.00 | 89.47 | 2.0 | 11.03 | 6.68 | 0.004 | 0.333 | 0.663 |
| 22 | Bermuda | Bermuda | BMU | 60 | NORTHERN AMERICA | 65773 | 53 | 1241.0 | 194.34 | 2.49 | ... | 851.4 | 20.00 | 0.00 | 80.00 | 2.0 | 11.40 | 7.74 | 0.010 | 0.100 | 0.890 |
| 28 | British Virgin Is. | British Virgin Is. | IOT | 86 | LATIN AMER. & CARIB | 23098 | 153 | 151.0 | 52.29 | 10.01 | ... | 506.5 | 20.00 | 6.67 | 73.33 | 2.0 | 14.89 | 4.42 | 0.018 | 0.062 | 0.920 |
| 38 | Cayman Islands | Cayman Islands | CYM | 136 | LATIN AMER. & CARIB | 45436 | 262 | 173.4 | 61.07 | 18.75 | ... | 836.3 | 3.85 | 0.00 | 96.15 | 2.0 | 12.74 | 4.89 | 0.014 | 0.032 | 0.954 |
| 47 | Cook Islands | Cook Islands | COK | 184 | OCEANIA | 21388 | 240 | 89.1 | 50.00 | NaN | ... | 289.9 | 17.39 | 13.04 | 69.57 | 2.0 | 21.00 | NaN | 0.151 | 0.096 | 0.753 |
| 56 | Dominica | Dominica | DMA | 212 | LATIN AMER. & CARIB | 68910 | 754 | 91.4 | 19.63 | -13.87 | ... | 304.8 | 6.67 | 20.00 | 73.33 | 2.0 | 15.27 | 6.73 | 0.177 | 0.328 | 0.495 |
| 66 | Faroe Islands | Faroe Islands | FRO | 234 | WESTERN EUROPE | 47246 | 1399 | 33.8 | 79.84 | 1.41 | ... | 503.8 | 2.14 | 0.00 | 97.86 | NaN | 14.05 | 8.70 | 0.270 | 0.110 | 0.620 |
| 77 | Gibraltar | Gibraltar | GIB | 292 | WESTERN EUROPE | 27928 | 7 | 3989.7 | 171.43 | 0.00 | ... | 877.7 | 0.00 | 0.00 | 100.00 | NaN | 10.74 | 9.31 | NaN | NaN | NaN |
| 79 | Greenland | Greenland | GRL | 304 | NORTHERN AMERICA | 56361 | 2166086 | 0.0 | 2.04 | -8.37 | ... | 448.9 | 0.00 | 0.00 | 100.00 | 1.0 | 15.93 | 7.84 | NaN | NaN | NaN |
| 80 | Grenada | Grenada | GRD | 308 | LATIN AMER. & CARIB | 89703 | 344 | 260.8 | 35.17 | -13.92 | ... | 364.5 | 5.88 | 29.41 | 64.71 | 2.0 | 22.08 | 6.88 | 0.054 | 0.180 | 0.766 |
| 84 | Guernsey | Guernsey | GGY | 831 | WESTERN EUROPE | 65409 | 78 | 838.6 | 64.10 | 3.84 | ... | 842.4 | NaN | NaN | NaN | 3.0 | 8.81 | 10.01 | 0.030 | 0.100 | 0.870 |
| 98 | Isle of Man | Isle of Man | IMN | 833 | WESTERN EUROPE | 75441 | 572 | 131.9 | 27.97 | 5.36 | ... | 676.0 | 9.00 | 0.00 | 91.00 | 3.0 | 11.05 | 11.19 | 0.010 | 0.130 | 0.860 |
| 103 | Jersey | Jersey | JEY | 832 | WESTERN EUROPE | 91084 | 116 | 785.2 | 60.34 | 2.76 | ... | 811.3 | 0.00 | 0.00 | 100.00 | 3.0 | 9.30 | 9.28 | 0.050 | 0.020 | 0.930 |
| 107 | Kiribati | Kiribati | KIR | 296 | OCEANIA | 105432 | 811 | 130.0 | 140.94 | 0.00 | ... | 42.7 | 2.74 | 50.68 | 46.58 | 2.0 | 30.65 | 8.26 | 0.089 | 0.242 | 0.668 |
| 118 | Liechtenstein | Liechtenstein | LIE | 438 | WESTERN EUROPE | 33987 | 160 | 212.4 | 0.00 | 4.85 | ... | 585.5 | 25.00 | 0.00 | 75.00 | 4.0 | 10.21 | 7.18 | 0.060 | 0.390 | 0.550 |
| 129 | Marshall Islands | Marshall Islands | MHL | 584 | OCEANIA | 60422 | 11854 | 5.1 | 3.12 | -6.04 | ... | 91.2 | 16.67 | 38.89 | 44.44 | 2.0 | 33.05 | 4.78 | 0.317 | 0.149 | 0.534 |
| 135 | Micronesia, Fed. St. | Micronesia, Fed. St. | FSM | 583 | OCEANIA | 108004 | 702 | 153.9 | 870.66 | -20.99 | ... | 114.8 | 5.71 | 45.71 | 48.58 | 2.0 | 24.68 | 4.75 | 0.289 | 0.152 | 0.559 |
| 137 | Monaco | Monaco | MCO | 492 | WESTERN EUROPE | 32543 | 2 | 16271.5 | 205.00 | 7.75 | ... | 1035.6 | 0.00 | 0.00 | 100.00 | NaN | 9.19 | 12.91 | 0.170 | NaN | NaN |
| 139 | Montserrat | Montserrat | MSR | 500 | LATIN AMER. & CARIB | 9439 | 102 | 92.5 | 39.22 | 0.00 | ... | NaN | 20.00 | 0.00 | 80.00 | 2.0 | 17.59 | 7.10 | NaN | NaN | NaN |
| 143 | Nauru | Nauru | NRU | 520 | OCEANIA | 13287 | 21 | 632.7 | 142.86 | 0.00 | ... | 143.0 | 0.00 | 0.00 | 100.00 | 2.0 | 24.76 | 6.70 | NaN | NaN | NaN |
| 152 | N. Mariana Islands | N. Mariana Islands | MMR | 104 | OCEANIA | 82459 | 477 | 172.9 | 310.69 | 9.61 | ... | 254.7 | 13.04 | 4.35 | 82.61 | 2.0 | 19.43 | 2.29 | NaN | NaN | NaN |
| 156 | Palau | Palau | PLW | 585 | OCEANIA | 20579 | 458 | 44.9 | 331.66 | 2.85 | ... | 325.6 | 8.70 | 4.35 | 86.95 | 2.0 | 18.03 | 6.80 | 0.062 | 0.120 | 0.818 |
| 170 | Saint Helena | Saint Helena | BLM | 652 | SUB-SAHARAN AFRICA | 7502 | 413 | 18.2 | 14.53 | 0.00 | ... | 293.3 | 12.90 | 0.00 | 87.10 | NaN | 12.13 | 6.53 | NaN | NaN | NaN |
| 171 | Saint Kitts & Nevis | Saint Kitts & Nevis | SHN | 654 | LATIN AMER. & CARIB | 39129 | 261 | 149.9 | 51.72 | -7.11 | ... | 638.9 | 19.44 | 2.78 | 77.78 | 2.0 | 18.02 | 8.33 | 0.035 | 0.258 | 0.707 |
| 173 | St Pierre & Miquelon | St Pierre & Miquelon | LKA | 144 | NORTHERN AMERICA | 7026 | 242 | 29.0 | 49.59 | -4.86 | ... | 683.2 | 13.04 | 0.00 | 86.96 | NaN | 13.52 | 6.83 | NaN | NaN | NaN |
| 174 | Saint Vincent and the Grenadines | Saint Vincent and the Grenadines | VCT | 670 | LATIN AMER. & CARIB | 117848 | 389 | 303.0 | 21.59 | -7.64 | ... | 190.9 | 17.95 | 17.95 | 64.10 | 2.0 | 16.18 | 5.98 | 0.100 | 0.260 | 0.640 |
| 176 | San Marino | San Marino | SMR | 674 | WESTERN EUROPE | 29251 | 61 | 479.5 | 0.00 | 10.98 | ... | 704.3 | 16.67 | 0.00 | 83.33 | NaN | 10.02 | 8.17 | NaN | NaN | NaN |
| 181 | Seychelles | Seychelles | SYC | 690 | SUB-SAHARAN AFRICA | 81541 | 455 | 179.2 | 107.91 | -5.69 | ... | 262.4 | 2.22 | 13.33 | 84.45 | 2.0 | 16.03 | 6.29 | 0.032 | 0.304 | 0.665 |
| 202 | Tonga | Tonga | TON | 776 | OCEANIA | 114689 | 748 | 153.3 | 56.02 | 0.00 | ... | 97.7 | 23.61 | 43.06 | 33.33 | 2.0 | 25.37 | 5.28 | 0.230 | 0.270 | 0.500 |
| 207 | Turks & Caicos Is | Turks & Caicos Is | TKM | 795 | LATIN AMER. & CARIB | 21152 | 430 | 49.2 | 90.47 | 11.68 | ... | 269.5 | 2.33 | 0.00 | 97.67 | 2.0 | 21.84 | 4.21 | NaN | NaN | NaN |
| 208 | Tuvalu | Tuvalu | TUV | 798 | OCEANIA | 11810 | 26 | 454.2 | 92.31 | 0.00 | ... | 59.3 | 0.00 | 0.00 | 100.00 | 2.0 | 22.18 | 7.11 | 0.166 | 0.272 | 0.562 |
| 219 | Virgin Islands | Virgin Islands | VIR | 850 | LATIN AMER. & CARIB | 108605 | 1910 | 56.9 | 9.84 | -8.94 | ... | 652.8 | 11.76 | 2.94 | 85.30 | 2.0 | 13.96 | 6.43 | 0.010 | 0.190 | 0.800 |
| 220 | Wallis and Futuna | Wallis and Futuna | WLF | 876 | OCEANIA | 16025 | 274 | 58.5 | 47.08 | NaN | ... | 118.6 | 5.00 | 25.00 | 70.00 | 2.0 | NaN | NaN | NaN | NaN | NaN |
37 rows × 23 columns
Now, let’s graph these countries. The easiest way to do this is to plug the query right into the call to create a Chart rather than assigning it to a variable first.
Chart(wd[wd.Population < 150000]).mark_point().encode(
    x='Population', y='Area', tooltip='Country').interactive()
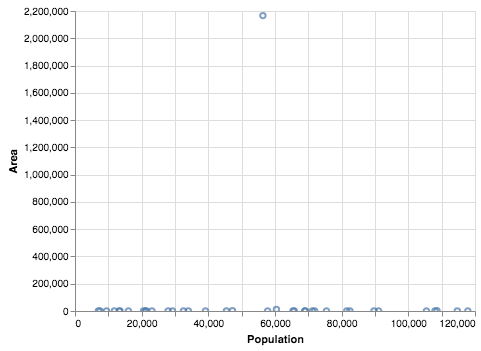
How interesting! One country has such a large value that it pushes all the others down. We added a tooltip parameter so that if you hover over that point, you will see it is Greenland (which has lots of land area, but not too many people). There are large universities that have more people than the entire country of Greenland. Let’s improve our query to focus on an area less than 200,000.
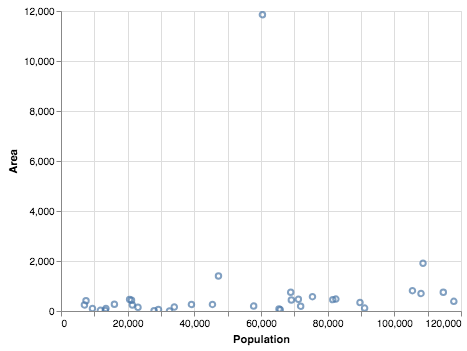
We can do more complicated boolean expressions by using the | (logical or)
and & (logical and) operators. Normally in Python, these two operators are
used for bitwise or and bitwise and. So, we can create a more complicated
boolean expression to limit our DataFrame in both directions.
wd[(wd.Population < 150000) & (wd.Area < 200000)]
| Country | Ct | Code | CodeNum | Region | Population | Area | Pop. Density | Coastline | Net migration | ... | Phones | Arable | Crops | Other | Climate | Birthrate | Deathrate | Agriculture | Industry | Service | |
|---|---|---|---|---|---|---|---|---|---|---|---|---|---|---|---|---|---|---|---|---|---|
| 3 | American Samoa | American Samoa | ASM | 16 | OCEANIA | 57794 | 199 | 290.4 | 58.29 | -20.71 | ... | 259.5 | 10.00 | 15.00 | 75.00 | 2.0 | 22.46 | 3.27 | NaN | NaN | NaN |
| 4 | Andorra | Andorra | AND | 20 | WESTERN EUROPE | 71201 | 468 | 152.1 | 0.00 | 6.60 | ... | 497.2 | 2.22 | 0.00 | 97.78 | 3.0 | 8.71 | 6.25 | NaN | NaN | NaN |
| 6 | Anguilla | Anguilla | AIA | 660 | LATIN AMER. & CARIB | 13477 | 102 | 132.1 | 59.80 | 10.76 | ... | 460.0 | 0.00 | 0.00 | 100.00 | 2.0 | 14.17 | 5.34 | 0.040 | 0.180 | 0.780 |
| 7 | Antigua & Barbuda | Antigua & Barbuda | ATA | 10 | LATIN AMER. & CARIB | 69108 | 443 | 156.0 | 34.54 | -6.15 | ... | 549.9 | 18.18 | 4.55 | 77.27 | 2.0 | 16.93 | 5.37 | 0.038 | 0.220 | 0.743 |
| 10 | Aruba | Aruba | ABW | 533 | LATIN AMER. & CARIB | 71891 | 193 | 372.5 | 35.49 | 0.00 | ... | 516.1 | 10.53 | 0.00 | 89.47 | 2.0 | 11.03 | 6.68 | 0.004 | 0.333 | 0.663 |
| 22 | Bermuda | Bermuda | BMU | 60 | NORTHERN AMERICA | 65773 | 53 | 1241.0 | 194.34 | 2.49 | ... | 851.4 | 20.00 | 0.00 | 80.00 | 2.0 | 11.40 | 7.74 | 0.010 | 0.100 | 0.890 |
| 28 | British Virgin Is. | British Virgin Is. | IOT | 86 | LATIN AMER. & CARIB | 23098 | 153 | 151.0 | 52.29 | 10.01 | ... | 506.5 | 20.00 | 6.67 | 73.33 | 2.0 | 14.89 | 4.42 | 0.018 | 0.062 | 0.920 |
| 38 | Cayman Islands | Cayman Islands | CYM | 136 | LATIN AMER. & CARIB | 45436 | 262 | 173.4 | 61.07 | 18.75 | ... | 836.3 | 3.85 | 0.00 | 96.15 | 2.0 | 12.74 | 4.89 | 0.014 | 0.032 | 0.954 |
| 47 | Cook Islands | Cook Islands | COK | 184 | OCEANIA | 21388 | 240 | 89.1 | 50.00 | NaN | ... | 289.9 | 17.39 | 13.04 | 69.57 | 2.0 | 21.00 | NaN | 0.151 | 0.096 | 0.753 |
| 56 | Dominica | Dominica | DMA | 212 | LATIN AMER. & CARIB | 68910 | 754 | 91.4 | 19.63 | -13.87 | ... | 304.8 | 6.67 | 20.00 | 73.33 | 2.0 | 15.27 | 6.73 | 0.177 | 0.328 | 0.495 |
| 66 | Faroe Islands | Faroe Islands | FRO | 234 | WESTERN EUROPE | 47246 | 1399 | 33.8 | 79.84 | 1.41 | ... | 503.8 | 2.14 | 0.00 | 97.86 | NaN | 14.05 | 8.70 | 0.270 | 0.110 | 0.620 |
| 77 | Gibraltar | Gibraltar | GIB | 292 | WESTERN EUROPE | 27928 | 7 | 3989.7 | 171.43 | 0.00 | ... | 877.7 | 0.00 | 0.00 | 100.00 | NaN | 10.74 | 9.31 | NaN | NaN | NaN |
| 80 | Grenada | Grenada | GRD | 308 | LATIN AMER. & CARIB | 89703 | 344 | 260.8 | 35.17 | -13.92 | ... | 364.5 | 5.88 | 29.41 | 64.71 | 2.0 | 22.08 | 6.88 | 0.054 | 0.180 | 0.766 |
| 84 | Guernsey | Guernsey | GGY | 831 | WESTERN EUROPE | 65409 | 78 | 838.6 | 64.10 | 3.84 | ... | 842.4 | NaN | NaN | NaN | 3.0 | 8.81 | 10.01 | 0.030 | 0.100 | 0.870 |
| 98 | Isle of Man | Isle of Man | IMN | 833 | WESTERN EUROPE | 75441 | 572 | 131.9 | 27.97 | 5.36 | ... | 676.0 | 9.00 | 0.00 | 91.00 | 3.0 | 11.05 | 11.19 | 0.010 | 0.130 | 0.860 |
| 103 | Jersey | Jersey | JEY | 832 | WESTERN EUROPE | 91084 | 116 | 785.2 | 60.34 | 2.76 | ... | 811.3 | 0.00 | 0.00 | 100.00 | 3.0 | 9.30 | 9.28 | 0.050 | 0.020 | 0.930 |
| 107 | Kiribati | Kiribati | KIR | 296 | OCEANIA | 105432 | 811 | 130.0 | 140.94 | 0.00 | ... | 42.7 | 2.74 | 50.68 | 46.58 | 2.0 | 30.65 | 8.26 | 0.089 | 0.242 | 0.668 |
| 118 | Liechtenstein | Liechtenstein | LIE | 438 | WESTERN EUROPE | 33987 | 160 | 212.4 | 0.00 | 4.85 | ... | 585.5 | 25.00 | 0.00 | 75.00 | 4.0 | 10.21 | 7.18 | 0.060 | 0.390 | 0.550 |
| 129 | Marshall Islands | Marshall Islands | MHL | 584 | OCEANIA | 60422 | 11854 | 5.1 | 3.12 | -6.04 | ... | 91.2 | 16.67 | 38.89 | 44.44 | 2.0 | 33.05 | 4.78 | 0.317 | 0.149 | 0.534 |
| 135 | Micronesia, Fed. St. | Micronesia, Fed. St. | FSM | 583 | OCEANIA | 108004 | 702 | 153.9 | 870.66 | -20.99 | ... | 114.8 | 5.71 | 45.71 | 48.58 | 2.0 | 24.68 | 4.75 | 0.289 | 0.152 | 0.559 |
| 137 | Monaco | Monaco | MCO | 492 | WESTERN EUROPE | 32543 | 2 | 16271.5 | 205.00 | 7.75 | ... | 1035.6 | 0.00 | 0.00 | 100.00 | NaN | 9.19 | 12.91 | 0.170 | NaN | NaN |
| 139 | Montserrat | Montserrat | MSR | 500 | LATIN AMER. & CARIB | 9439 | 102 | 92.5 | 39.22 | 0.00 | ... | NaN | 20.00 | 0.00 | 80.00 | 2.0 | 17.59 | 7.10 | NaN | NaN | NaN |
| 143 | Nauru | Nauru | NRU | 520 | OCEANIA | 13287 | 21 | 632.7 | 142.86 | 0.00 | ... | 143.0 | 0.00 | 0.00 | 100.00 | 2.0 | 24.76 | 6.70 | NaN | NaN | NaN |
| 152 | N. Mariana Islands | N. Mariana Islands | MMR | 104 | OCEANIA | 82459 | 477 | 172.9 | 310.69 | 9.61 | ... | 254.7 | 13.04 | 4.35 | 82.61 | 2.0 | 19.43 | 2.29 | NaN | NaN | NaN |
| 156 | Palau | Palau | PLW | 585 | OCEANIA | 20579 | 458 | 44.9 | 331.66 | 2.85 | ... | 325.6 | 8.70 | 4.35 | 86.95 | 2.0 | 18.03 | 6.80 | 0.062 | 0.120 | 0.818 |
| 170 | Saint Helena | Saint Helena | BLM | 652 | SUB-SAHARAN AFRICA | 7502 | 413 | 18.2 | 14.53 | 0.00 | ... | 293.3 | 12.90 | 0.00 | 87.10 | NaN | 12.13 | 6.53 | NaN | NaN | NaN |
| 171 | Saint Kitts & Nevis | Saint Kitts & Nevis | SHN | 654 | LATIN AMER. & CARIB | 39129 | 261 | 149.9 | 51.72 | -7.11 | ... | 638.9 | 19.44 | 2.78 | 77.78 | 2.0 | 18.02 | 8.33 | 0.035 | 0.258 | 0.707 |
| 173 | St Pierre & Miquelon | St Pierre & Miquelon | LKA | 144 | NORTHERN AMERICA | 7026 | 242 | 29.0 | 49.59 | -4.86 | ... | 683.2 | 13.04 | 0.00 | 86.96 | NaN | 13.52 | 6.83 | NaN | NaN | NaN |
| 174 | Saint Vincent and the Grenadines | Saint Vincent and the Grenadines | VCT | 670 | LATIN AMER. & CARIB | 117848 | 389 | 303.0 | 21.59 | -7.64 | ... | 190.9 | 17.95 | 17.95 | 64.10 | 2.0 | 16.18 | 5.98 | 0.100 | 0.260 | 0.640 |
| 176 | San Marino | San Marino | SMR | 674 | WESTERN EUROPE | 29251 | 61 | 479.5 | 0.00 | 10.98 | ... | 704.3 | 16.67 | 0.00 | 83.33 | NaN | 10.02 | 8.17 | NaN | NaN | NaN |
| 181 | Seychelles | Seychelles | SYC | 690 | SUB-SAHARAN AFRICA | 81541 | 455 | 179.2 | 107.91 | -5.69 | ... | 262.4 | 2.22 | 13.33 | 84.45 | 2.0 | 16.03 | 6.29 | 0.032 | 0.304 | 0.665 |
| 202 | Tonga | Tonga | TON | 776 | OCEANIA | 114689 | 748 | 153.3 | 56.02 | 0.00 | ... | 97.7 | 23.61 | 43.06 | 33.33 | 2.0 | 25.37 | 5.28 | 0.230 | 0.270 | 0.500 |
| 207 | Turks & Caicos Is | Turks & Caicos Is | TKM | 795 | LATIN AMER. & CARIB | 21152 | 430 | 49.2 | 90.47 | 11.68 | ... | 269.5 | 2.33 | 0.00 | 97.67 | 2.0 | 21.84 | 4.21 | NaN | NaN | NaN |
| 208 | Tuvalu | Tuvalu | TUV | 798 | OCEANIA | 11810 | 26 | 454.2 | 92.31 | 0.00 | ... | 59.3 | 0.00 | 0.00 | 100.00 | 2.0 | 22.18 | 7.11 | 0.166 | 0.272 | 0.562 |
| 219 | Virgin Islands | Virgin Islands | VIR | 850 | LATIN AMER. & CARIB | 108605 | 1910 | 56.9 | 9.84 | -8.94 | ... | 652.8 | 11.76 | 2.94 | 85.30 | 2.0 | 13.96 | 6.43 | 0.010 | 0.190 | 0.800 |
| 220 | Wallis and Futuna | Wallis and Futuna | WLF | 876 | OCEANIA | 16025 | 274 | 58.5 | 47.08 | NaN | ... | 118.6 | 5.00 | 25.00 | 70.00 | 2.0 | NaN | NaN | NaN | NaN | NaN |
36 rows × 23 columns
Chart(wd[(wd.Population < 150000) & (wd.Area < 200000)]).mark_point().encode(
    x='Population', y='Area', tooltip='Country').interactive()
Suppose you have a favorite country you have visited or lived in at some point. For example, if you lived in Malta for six months, you might be curious about Malta. Let’s see what data we have in the data frame for Malta using an equality.
wd[wd.Country == 'Malta']
| Country | Ct | Code | CodeNum | Region | Population | Area | Pop. Density | Coastline | Net migration | ... | Phones | Arable | Crops | Other | Climate | Birthrate | Deathrate | Agriculture | Industry | Service |
|---|
0 rows × 23 columns
It seems odd that Malta would not be in the dataset. Let’s try some other countries; nothing seems to work. One common problem is that names and other strings can end up with spaces at the beginning or the end of the word or phrase. If you do a quick try, you will see that ‘Malta ‘ works, but that is inconvenient. We don’t want to have to remember to put spaces at the end of every string all the time. We should do a bit of data cleanup and strip those spaces.
wd[wd.Country == 'Malta ']
| Country | Ct | Code | CodeNum | Region | Population | Area | Pop. Density | Coastline | Net migration | ... | Phones | Arable | Crops | Other | Climate | Birthrate | Deathrate | Agriculture | Industry | Service | |
|---|---|---|---|---|---|---|---|---|---|---|---|---|---|---|---|---|---|---|---|---|---|
| 128 | Malta | Malta | MLT | 470 | WESTERN EUROPE | 400214 | 316 | 1266.5 | 62.28 | 2.07 | ... | 505.0 | 28.13 | 3.13 | 68.74 | NaN | 10.22 | 8.1 | 0.03 | 0.23 | 0.74 |
1 rows × 23 columns
You may recall that Python has a string method called strip that does
exactly what we want. How can we get that to apply to all of the strings in the
Series? Pandas allow us to do this using the str attribute of the series in
combination with most of the standard string methods you know about.
wd.Country.str.strip()
0                                            Afghanistan
1                                                Albania
2                                                Algeria
3                                         American Samoa
4                                                Andorra
5                                                 Angola
6                                               Anguilla
7                                      Antigua & Barbuda
8                                              Argentina
9                                                Armenia
10                                                 Aruba
11                                             Australia
12                                               Austria
13                                            Azerbaijan
14                                          Bahamas, The
15                                               Bahrain
16                                            Bangladesh
17                                              Barbados
18                                               Belarus
19                                               Belgium
20                                                Belize
21                                                 Benin
22                                               Bermuda
23                                                Bhutan
24                                               Bolivia
25                                  Bosnia & Herzegovina
26                                              Botswana
27                                                Brazil
28                                    British Virgin Is.
29                                                Brunei
                             ...
195                                          Switzerland
196                                                Syria
197                                               Taiwan
198                                           Tajikistan
199                                             Tanzania
200                                             Thailand
201                                                 Togo
202                                                Tonga
203                                    Trinidad & Tobago
204                                              Tunisia
205                                               Turkey
206                                         Turkmenistan
207                                    Turks & Caicos Is
208                                               Tuvalu
209                                               Uganda
210                                              Ukraine
211                                 United Arab Emirates
212    United Kingdom of Great Britain and Northern I...
213                             United States of America
214                                              Uruguay
215                                           Uzbekistan
216                                              Vanuatu
217                                            Venezuela
218                                              Vietnam
219                                       Virgin Islands
220                                    Wallis and Futuna
221                                       Western Sahara
222                                                Yemen
223                                               Zambia
224                                             Zimbabwe
Name: Country, Length: 225, dtype: object
Now, we can replace our original Country column with the stripped column.
wd['Country'] = wd.Country.str.strip()
wd[wd.Country == 'Malta']
| Country | Ct | Code | CodeNum | Region | Population | Area | Pop. Density | Coastline | Net migration | ... | Phones | Arable | Crops | Other | Climate | Birthrate | Deathrate | Agriculture | Industry | Service | |
|---|---|---|---|---|---|---|---|---|---|---|---|---|---|---|---|---|---|---|---|---|---|
| 128 | Malta | Malta | MLT | 470 | WESTERN EUROPE | 400214 | 316 | 1266.5 | 62.28 | 2.07 | ... | 505.0 | 28.13 | 3.13 | 68.74 | NaN | 10.22 | 8.1 | 0.03 | 0.23 | 0.74 |
1 rows × 23 columns
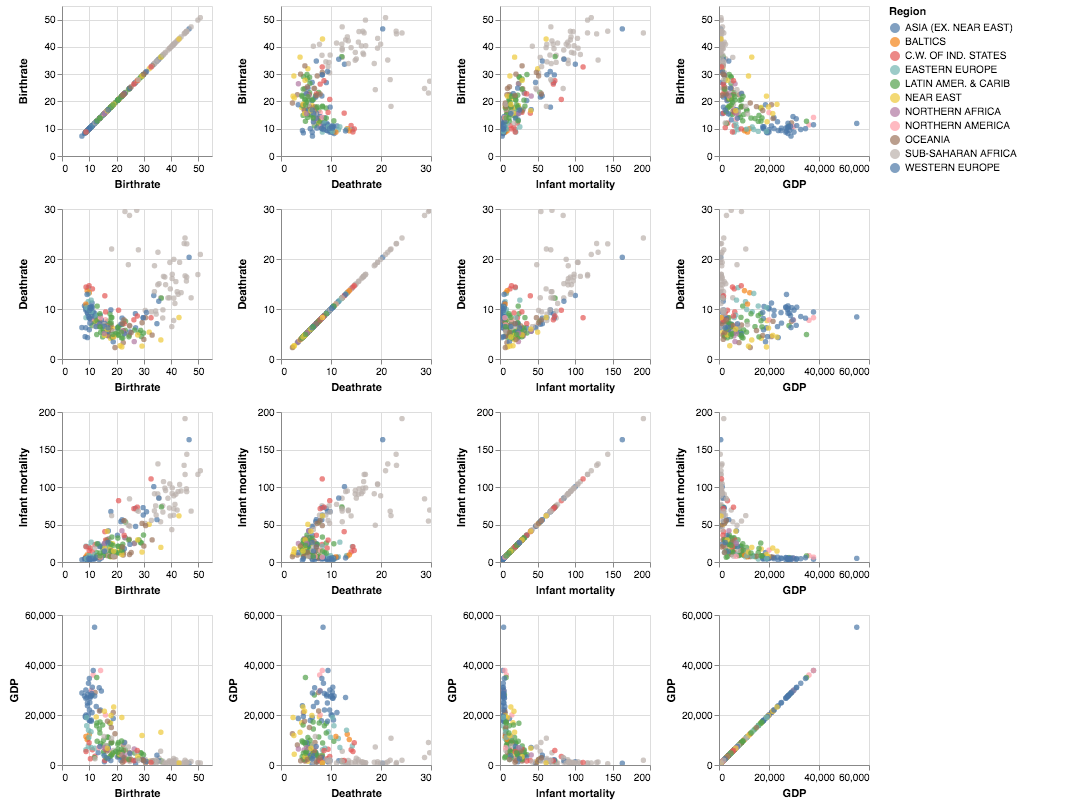
6.2.6. Power Tools: Scatter Matrix
It would be pretty tedious to look at all the different pairs of things we might want to look at for correlation one at a time, but we can use a scatter matrix to make life easier.
alt.Chart(wd).mark_circle().encode(
    alt.X(alt.repeat("column"), type='quantitative'),
    alt.Y(alt.repeat("row"), type='quantitative'),
    color='Region:N'
).properties(
    width=150,
    height=150
).repeat(
    row=['Birthrate', 'Deathrate', 'Infant mortality', 'GDP'],
    column=['Birthrate', 'Deathrate', 'Infant mortality', 'GDP']
).interactive()
list(reversed(['a','b']))
['b', 'a']
6.2.7. Developing Fluency
Pandas will only become a part of your daily workflow when you develop fluency with the basics. You need to be able to do easy queries without having to think hard about the syntax. The only way to accomplish this is through repetition: lots of repetition, and ideally that repetitive practice is spread out over time.
That doesn’t mean you can’t go on and do lots of much harder things, it just means that it will take longer at first, as you have to go back and review documentation in order to become efficient.
6.2.8. Practice Questions
What are the top 10 countries by GDP?
What are the top 20 countries by population?
What are the 10 countries with the largest net migration?
What is the distribution of Agriculture, Industry, and service for the countries in Western Europe?
What are the names, population and, Area of the 5 largest (by area) landlocked countries?
What are the names and populations of the five most populous landlocked countries?
What is the name and GDP of the 10 countries with the most cell phones/1000 people?
What are the 10 “Wet Tropical” countries with the highest GDP?
Lesson Feedback
-
During this lesson I was primarily in my...
- 1. Comfort Zone
- 2. Learning Zone
- 3. Panic Zone
-
Completing this lesson took...
- 1. Very little time
- 2. A reasonable amount of time
- 3. More time than is reasonable
-
Based on my own interests and needs, the things taught in this lesson...
- 1. Don't seem worth learning
- 2. May be worth learning
- 3. Are definitely worth learning
-
For me to master the things taught in this lesson feels...
- 1. Definitely within reach
- 2. Within reach if I try my hardest
- 3. Out of reach no matter how hard I try