
6.6. Case Study 2: Analyzing Protecting Minority Investors
In this section, we will walk you through the process of analyzing and inspecting data. We will go over the process of modeling and visualizing a data set with a different set of tools. For this case study, we will use the World Bank Data on Protecting Minority Investors which was provided to you in the introduction.
6.6.1. Loading Minority Investors Data into a DataFrame
To get our first glimpse at Pandas and its capabilities, we will be using the data about the countries we used in the spreadsheet module. In the following block of code, you will see the first few lines of the raw CSV file for this project. It may look intimidating, but we will unpack it as we go.
location,protecting_minority_investors_rank,protecting_minority_investors_score,strength_of_minority_investor_protection_index_(0-50),extent_of_disclosure_index_(0-10),extent_of_director_liability_index_(0-10),ease_of_shareholder_suits_index_(0-10),extent_of_shareholder_rights_index_(0-6),extent_of_ownership_and_control_index_(0-7),extent_of_corporate_transparency_index_(0-7),starting_a_business_score
Afghanistan,140,36.0,18,8.0,1.0,9.0,0.0,0.0,0.0,92
Albania,111,46.0,23,9.0,7.0,7.0,0.0,0.0,0.0,91.8
Algeria,179,20.0,10,4.0,1.0,5.0,0.0,0.0,0.0,78
Angola,147,32.0,16,4.0,6.0,6.0,0.0,0.0,0.0,79.4
In case we have forgotten, here is the link to the documentation on how to read and parse CSV files with Python.
%matplotlib inline

import pandas as pd
import matplotlib
import matplotlib.pyplot as plt
import psycopg2
import textatistic
import seaborn as sbn
from altair import Chart, X, Y, Color, Scale
import altair as alt
from vega_datasets import data
import requests
from bs4 import BeautifulSoup
matplotlib.style.use('ggplot')
# for plotly py.offline.init_notebook_mode()
First, let’s read the protecting minority investors CSV file using Pandas read_csv function.
wd = pd.read_csv('protecting_minority_investors.csv')
wd.head()
| location | protecting_minority_investors_rank | protecting_minority_investors_score | strength_of_minority_investor_protection_index_(0-50) | extent_of_disclosure_index_(0-10) | extent_of_director_liability_index_(0-10) | ease_of_shareholder_suits_index_(0-10) | extent_of_shareholder_rights_index_(0-6) | extent_of_ownership_and_control_index_(0-7) | extent_of_corporate_transparency_index_(0-7) | starting_a_business_score | |
|---|---|---|---|---|---|---|---|---|---|---|---|
| 0 | Afghanistan | 140.0 | 36.0 | 18 | 8.0 | 1.0 | 9.0 | 0.0 | 0.0 | 0.0 | 92.0 |
| 1 | Albania | 111.0 | 46.0 | 23 | 9.0 | 7.0 | 7.0 | 0.0 | 0.0 | 0.0 | 91.8 |
| 2 | Algeria | 179.0 | 20.0 | 10 | 4.0 | 1.0 | 5.0 | 0.0 | 0.0 | 0.0 | 78.0 |
| 3 | Angola | 147.0 | 32.0 | 16 | 4.0 | 6.0 | 6.0 | 0.0 | 0.0 | 0.0 | 79.4 |
| 4 | Antigua and Barbuda | 79.0 | 58.0 | 29 |
6.6.2. Describing Minority Investors
Location
Protecting Minority Investors rank
Protecting Minority Investors score
Strength of minority investor protection index (0-50)
Extent of director liability index (0-10)
Ease of shareholder suits index (0-10)
Extent of shareholder rights index (0-6)
Extent of ownership and control index (0-7)
Extent of corporate transparency index (0-7)
Let’s use our handy method that Pandas provides us with, describe, to get some statistical data.
wd.describe()
| protecting_minority_investors_rank | protecting_minority_investors_score | strength_of_minority_investor_protection_index_(0-50) | extent_of_disclosure_index_(0-10) | extent_of_director_liability_index_(0-10) | ease_of_shareholder_suits_index_(0-10) | extent_of_shareholder_rights_index_(0-6) | extent_of_ownership_and_control_index_(0-7) | extent_of_corporate_transparency_index_(0-7) | starting_a_business_score | |
|---|---|---|---|---|---|---|---|---|---|---|
| count | 190.000000 | 191.000000 | 191.000000 | 191.000000 | 191.000000 | 191.000000 | 191.000000 | 191.000000 | 191.000000 | 191.000000 |
| mean | 92.973684 | 51.568586 | 25.785340 | 5.827225 | 4.732984 | 6.345550 | 2.947644 | 2.821990 | 3.104712 | 84.366492 |
| std | 55.125968 | 20.099831 | 10.050975 | 2.562173 | 2.664960 | 1.907318 | 2.233096 | 2.406075 | 2.593419 | 11.250751 |
| min | 1.000000 | 0.000000 | 0.000000 | 0.000000 | 0.000000 | 0.000000 | 0.000000 | 0.000000 | 0.000000 | 25.000000 |
| 25% | 45.000000 | 34.000000 | 17.000000 | 4.000000 | 2.000000 | 5.000000 | 0.000000 | 0.000000 | 0.000000 | 80.000000 |
| 50% | 88.000000 | 56.000000 | 28.000000 | 6.000000 | 5.000000 | 6.000000 | 4.000000 | 3.000000 | 3.000000 | 87.000000 |
| 75% | 142.250000 | 68.000000 | 34.000000 | 8.000000 | 7.000000 | 8.000000 | 5.000000 | 5.000000 | 6.000000 | 92.250000 |
| max | 190.000000 | 92.000000 | 46.000000 | 10.000000 | 10.000000 | 10.000000 | 6.000000 | 7.000000 | 7.000000 | 100.000000 |
6.6.3. Visualizing Minority Investors with a Histogram
c = Chart(wd) # make a chart
m = c.mark_bar() # set the mark -- returns a new Chart
e = m.encode(X('protecting_minority_investors_score',bin=True),y='count()') # set the encoding
e.display()

As you may recall from case study 1, we can shorten the steps above of creating a histogram using a shortcut. Let’s write all of the above calls into a single line.
Chart(wd).mark_bar().encode(x=X('protecting_minority_investors_score', bin=True), y='count()')
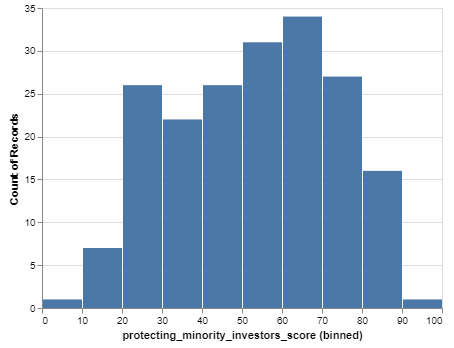
Q-1: How many countries have a score between 8.0 and 9.0 in the extent of the director liability index?
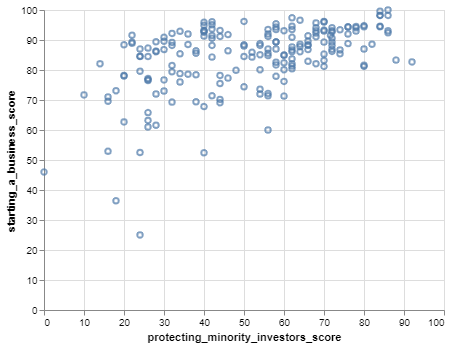
6.6.4. Discovering Relationships with Scatter Plots
We can visualize and show the relationship between data using scatter plots. Let’s make a simple scatter plot of protecting_minority_investors_score versus starting_a_business_score of the locations. For this exercise, we will use Protecting Minority Investors CSV file.
Chart(wd).mark_point().encode(x='protecting_minority_investors_score', y='starting_a_business_score', tooltip='location')
Now, let us focus on the locations where protecting_minority_investors_score is less than 50, and the starting_a_business_score is less than 70. Let’s start with the first part.
To do this, we will create a new DataFrame where we focus on the locations where the protecting_minority_investors_score is less than 50, and the locations starting_a_business_score is less than 70. Pandas make this easy with its querying power.
The statement below produces a series of boolean values. These boolean values are used to index the data frame and only the rows corresponding to True values are returned in the result.
(wd.protecting_minority_investors_score < 50).head(20)
0     True
1     True
2     True
3     True
4     True
5     True
6     True
7     True
8     True
9     True
10    True
11    True
12    True
13    True
14    True
15    True
16    True
17    True
18    True
19    True
Name: Population, dtype: bool
Let’s look at the locations of less than 20.
wd[wd.protecting_minority_investors_score < 20]
| location | protecting_minority_investors_rank | protecting_minority_investors_score | strength_of_minority_investor_protection_index_(0-50) | extent_of_disclosure_index_(0-10) | extent_of_director_liability_index_(0-10) | ease_of_shareholder_suits_index_(0-10) | extent_of_shareholder_rights_index_(0-6) | extent_of_ownership_and_control_index_(0-7) | extent_of_corporate_transparency_index_(0-7) | starting_a_business_score | |
|---|---|---|---|---|---|---|---|---|---|---|---|
| 52 | Eritrea | 185.0 | 16.0 | 8 | 3 | 0 | 5 | 0 | 0 | 0 | 52.9 |
| 55 | Ethiopia | 189.0 | 10.0 | 5 | 3 | 0 | 2 | 0 | 0 | 0 | 71.7 |
| 70 | Haiti | 183.0 | 18.0 | 9 | 2 | 3 | 4 | 0 | 0 | 0 | 36.4 |
| 97 | Libya | 183.0 | 18.0 | 9 | 4 | 1 | 4 | 0 | 0 | 0 | 73.1 |
| 111 | Micronesia, Fed. Sts. | 185.0 | 16.0 | 8 | 0 | 0 | 8 | 0 | 0 | 0 | 69.6 |
| 129 | Palau | 188.0 | 14.0 | 7 | 0 | 0 | 7 | 0 | 0 | 0 | 82.1 |
| 154 | Somalia | 190.0 | 0.0 | 0 | 0 | 0 | 0 | 0 | 0 | 0 | 46.0 |
| 156 | South Sudan | 185.0 | 16.0 | 8 | 2 | 1 | 5 | 0 | 0 | 0 | 71.0 |
Next, we can use this information and graph these locations to get a visual representation of the data. You can do this two ways; you can assign your query to a variable and put the variable in the call to create a chart. Or, you can put the query right into the call to create a chart.
Chart(wd[wd.protecting_minority_investors_score < 50]).mark_point().encode(
    x='protecting_minority_investors_score', y='starting_a_business_score', tooltip='location').interactive()
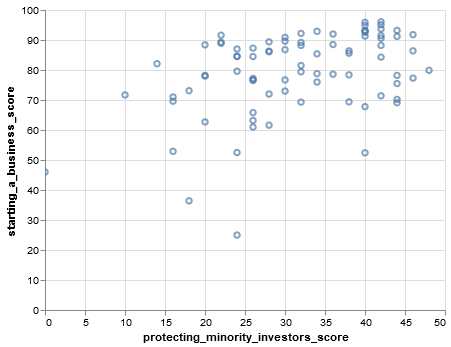
Pretty neat! As we can see, one location has a minimal value while others are farther to the right. This graph encapsulates all the protecting_minority_investors_score that is less than 20; we also added a tooltip parameter so that if you hover over that point, you will see it is Somalia. Let’s improve our query to focus on the locations where starting_a_business_score is less than 70.
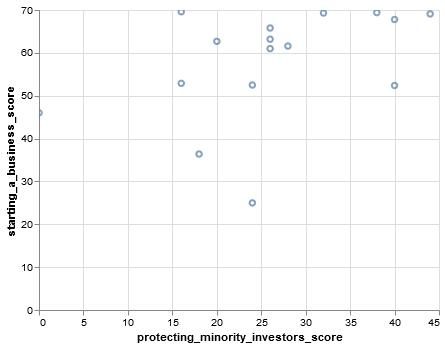
We can create a more complicated boolean expression by using | (logical or)
and & (logical and) operators.
wd[(wd.protecting_minority_investors_score < 50) & (wd.starting_a_business_score < 70)]
| location | protecting_minority_investors_rank | protecting_minority_investors_score | strength_of_minority_investor_protection_index_(0-50) | extent_of_disclosure_index_(0-10) | extent_of_director_liability_index_(0-10) | ease_of_shareholder_suits_index_(0-10) | extent_of_shareholder_rights_index_(0-6) | extent_of_ownership_and_control_index_(0-7) | extent_of_corporate_transparency_index_(0-7) | starting_a_business_score | |
|---|---|---|---|---|---|---|---|---|---|---|---|
| 19 | Bolivia | 136.0 | 38.0 | 19 | 1.0 | 5.0 | 6.0 | 4.0 | 1.0 | 2.0 | 69.4 |
| 28 | Cambodia | 128.0 | 40.0 | 20 | 6.0 | 10.0 | 4.0 | 0.0 | 0.0 | 0.0 | 52.4 |
| 31 | Central African Republic | 162.0 | 26.0 | 13 | 7.0 | 1.0 | 5.0 | 0.0 | 0.0 | 0.0 | 63.2 |
| 32 | Chad | 170.0 | 24.0 | 12 | 7.0 | 1.0 | 4.0 | 0.0 | 0.0 | 0.0 | 52.5 |
| 38 | Congo, Rep. | 162.0 | 26.0 | 13 | 7.0 | 1.0 | 5.0 | 0.0 | 0.0 | 0.0 | 65.8 |
| 48 | Ecuador | 114.0 | 44.0 | 22 | 2.0 | 5.0 | 6.0 | 5.0 | 3.0 | 1.0 | 69.1 |
| 51 | Equatorial Guinea | 162.0 | 26.0 | 13 | 7.0 | 1.0 | 5.0 | 0.0 | 0.0 | 0.0 | 61.0 |
| 52 | Eritrea | 185.0 | 16.0 | 8 | 3.0 | 0.0 | 5.0 | 0.0 | 0.0 | 0.0 | 52.9 |
| 70 | Haiti | 183.0 | 18.0 | 9 | 2.0 | 3.0 | 4.0 | 0.0 | 0.0 | 0.0 | 36.4 |
| 77 | Iran, Islamic Rep. | 128.0 | 40.0 | 20 | 7.0 | 4.0 | 1.0 | 3.0 | 3.0 | 2.0 | 67.8 |
| 92 | Lao PDR | 179.0 | 20.0 | 10 | 6.0 | 1.0 | 3.0 | 0.0 | 0.0 | 0.0 | 62.7 |
| 111 | Micronesia, Fed. Sts. | 185.0 | 16.0 | 8 | 0.0 | 0.0 | 8.0 | 0.0 | 0.0 | 0.0 | 69.6 |
| 116 | Mozambique | 147.0 | 32.0 | 16 | 5.0 | 4.0 | 7.0 | 0.0 | 0.0 | 0.0 | 69.3 |
| 154 | Somalia | 190.0 | 0.0 | 0 | 0.0 | 0.0 | 0.0 | 0.0 | 0.0 | 0.0 | 46.0 |
| 163 | Suriname | 157.0 | 28.0 | 14 | 1.0 | 0.0 | 6.0 | 4.0 | 2.0 | 1.0 | 61.6 |
| 185 | Venezuela, RB | 170.0 | 24.0 | 12 | 3.0 | 2.0 | 3.0 | 1.0 | 2.0 | 1.0 | 25.0 |
Chart(wd[(wd.protecting_minority_investors_score < 50) & (wd.starting_a_business_score < 70)]).mark_point().encode(
    x='protecting_minority_investors_score', y='starting_a_business_score', tooltip='location').interactive()
Now, let’s suppose you want to travel and start your dream business in one of your favorite locations. For example, let’s say you have always wanted to go to Malta and start your business. Let’s see what business-related data we have in the data frame for Malta using equality.
wd[wd.location == 'Malta']
| location | protecting_minority_investors_rank | protecting_minority_investors_score | strength_of_minority_investor_protection_index_(0-50) | extent_of_disclosure_index_(0-10) | extent_of_director_liability_index_(0-10) | ease_of_shareholder_suits_index_(0-10) | extent_of_shareholder_rights_index_(0-6) | extent_of_ownership_and_control_index_(0-7) | extent_of_corporate_transparency_index_(0-7) | starting_a_business_score | |
|---|---|---|---|---|---|---|---|---|---|---|---|
| 106 | Malta | 51 | 66 | 33 | 3 | 6 | 8 | 6 | 4 | 6 | 88.2 |
As you can see, we found very interesting information about Malta. You can try some other countries on your own but keep in mind that sometimes names and other string can end up with spaces at the beginning or the end of the word or phrase. For instance, Malta could have ended up with space at the end of the data set. We might not have been able to get the information using ‘Malta’ and might have had to type ‘Malta ‘. This would have been very inconvenient, and we don’t want to have to remember to put spaces at the beginning or end of every string. Therefore, we always need to do a bit of cleanup to strip those spaces.
As you may recall, Python has a method called strip which does what we want, it removes characters
from left and right based on the argument passed. Also, Pandas allows us to do this using the str attribute
of the series in combination with most of the standard string methods you know.
wd.location.str.strip()
0              Afghanistan
1                  Albania
2                  Algeria
3                   Angola
4      Antigua and Barbuda
            ...
186                Vietnam
187     West Bank and Gaza
188            Yemen, Rep.
189                 Zambia
190               Zimbabwe
Name: location, Length: 191, dtype: object
If Malta had a space after it, the strip method would get rid of it, and we could just use ‘Malta’ to get the necessary information from our data set.
wd[wd.location == 'Malta']
| location | protecting_minority_investors_rank | protecting_minority_investors_score | strength_of_minority_investor_protection_index_(0-50) | extent_of_disclosure_index_(0-10) | extent_of_director_liability_index_(0-10) | ease_of_shareholder_suits_index_(0-10) | extent_of_shareholder_rights_index_(0-6) | extent_of_ownership_and_control_index_(0-7) | extent_of_corporate_transparency_index_(0-7) | starting_a_business_score | |
|---|---|---|---|---|---|---|---|---|---|---|---|
| 106 | Malta | 51 | 66 | 33 | 3 | 6 | 8 | 6 | 4 | 6 | 88.2 |
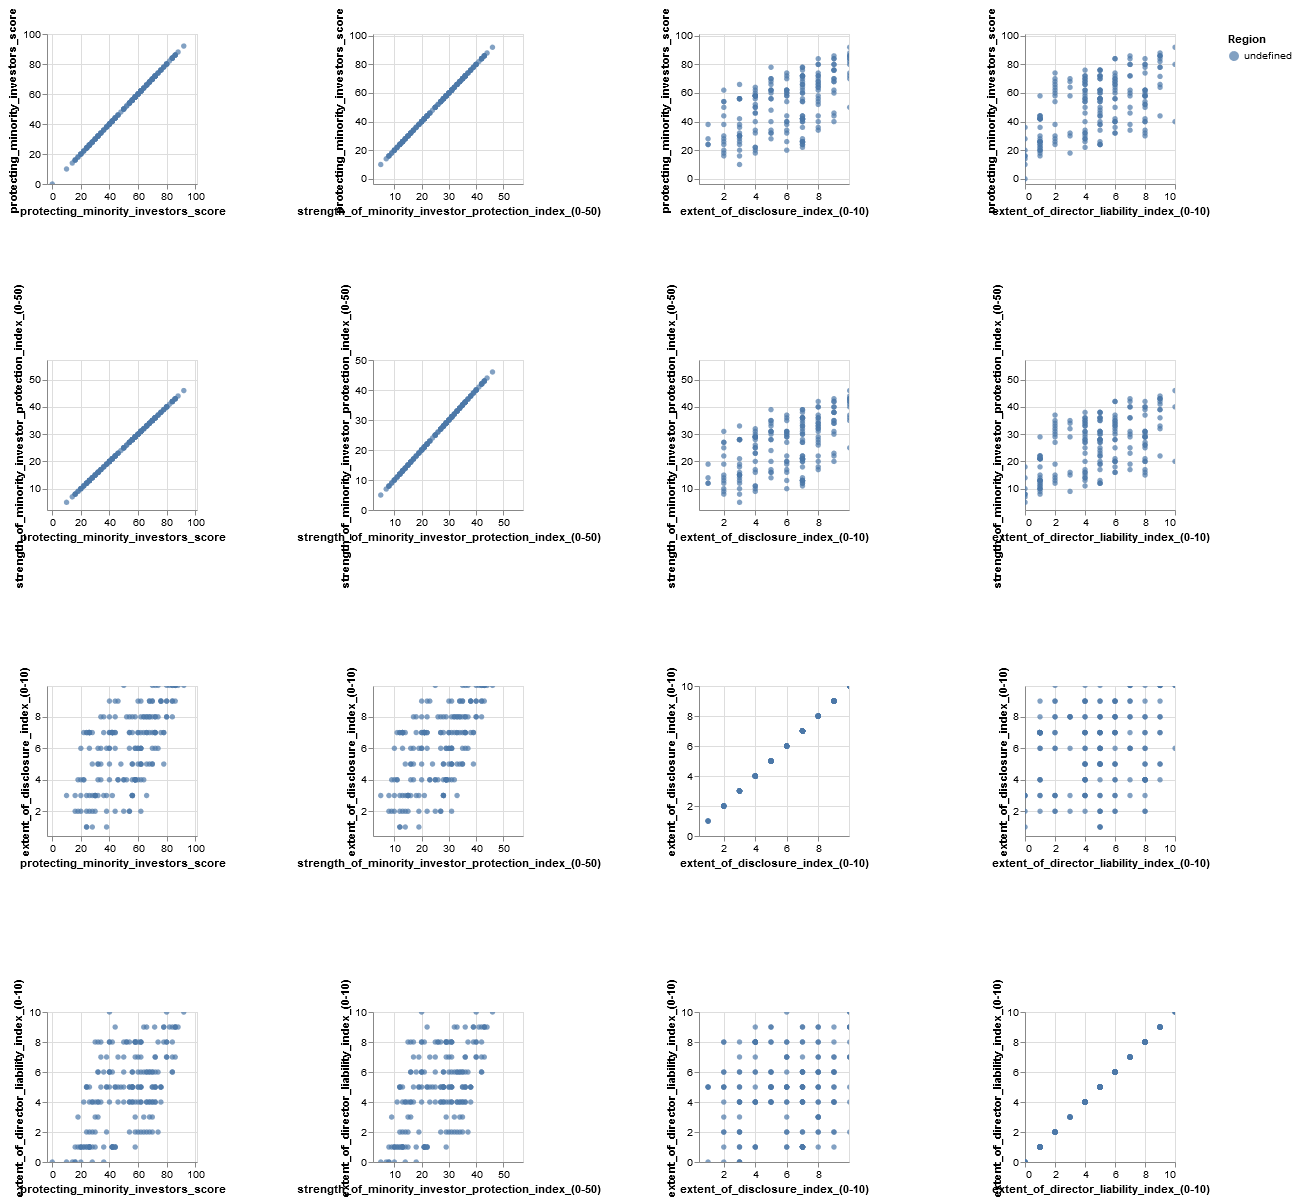
6.6.5. Minority Investors: Scatter Matrix
Let’s use scatter matrix to see correlation between multiple pairs of things at once.
alt.Chart(wd).mark_circle().encode(
    alt.X(alt.repeat("column"), type='quantitative'),
    alt.Y(alt.repeat("row"), type='quantitative'),
    color='Region:N'
).properties(
    width=150,
    height=150
).repeat(
    row=['protecting_minority_investors_score', 'strength_of_minority_investor_protection_index_(0-50)', 'extent_of_disclosure_index_(0-10)', 'extent_of_director_liability_index_(0-10)'],
    column=['protecting_minority_investors_score', 'strength_of_minority_investor_protection_index_(0-50)', 'extent_of_disclosure_index_(0-10)', 'extent_of_director_liability_index_(0-10)']
).interactive()
list(reversed(['a','b']))
['b', 'a']
6.6.6. Practice Questions
What are the top 10 countries by starting a business score?
What are the top 20 countries by protecting minority investors’ scores?
What are the names and their starting a business score of the five ranked countries?
Lesson Feedback
-
During this lesson I was primarily in my...
- 1. Comfort Zone
- 2. Learning Zone
- 3. Panic Zone
-
Completing this lesson took...
- 1. Very little time
- 2. A reasonable amount of time
- 3. More time than is reasonable
-
Based on my own interests and needs, the things taught in this lesson...
- 1. Don't seem worth learning
- 2. May be worth learning
- 3. Are definitely worth learning
-
For me to master the things taught in this lesson feels...
- 1. Definitely within reach
- 2. Within reach if I try my hardest
- 3. Out of reach no matter how hard I try