
7.5. Data Map App
Time Estimate: 45 minutes
7.5.1. Introduction and Goals
| In this lesson, you will build an App Inventor app that visualizes data in a map. The Data Map app uses a GeoJSON data file to draw states on the map. Then, a spreadsheet CSV file of data about the states is read in and displayed when each state is clicked. | |
| (TeacherTube Version) |
Learning Objectives: I will learn to
Language Objectives: I will be able to
|
7.5.2. Learning Activities
Data Sources
Data sources can be included and used in App Inventor apps in 3 different ways.- Manually constructing lists of data. Create a list and add each item of data as an element to the list. This is good for small amounts of data, but not a good option if there is a lot of data or the data changes frequently (such as weather, sports statistics, or stock prices).
- Uploading data files into the Media section. This is a good option for larger amounts of data, especially if you can find a file that has the data you need already in it. It is not a good option if the data changes frequently.
- Using a web API to read in the data. This is a good option if the data changes frequently.
Often a single data source does not contain the necessary data to draw a conclusion. It may be required to combine data from a variety of sources to formulate a conclusion. This app uses 2 data files which are already uploaded into the app template in its Media section. The first data file is a Comma-Separated-Values (CSV) file. Any spreadsheet in Excel or Google Sheets can be saved as a .csv file which just has the text separated by commas, which is a great format for importing into App Inventor. The .csv file in this app contains state data from the Center for Disease Control (CDC) that includes data about each state's population, non-insured rate, firearms death rates, drug overdose death rates, and a URL for state information at the CDC website.
The second file, US States GeoJSON, loads in the polygon shapes of each state to overlay on the map so that we can click on them. GeoJSON.org (pronounced geo-jay-sun) is a standard agreed-upon format for geographical information used on the web and in data files. JSON.org is a general format that describes features and values for any object that many web servers use to communicate and store data. If you open this us_states.geojson file, you'll see that it has a set of latitude and longitude pairs that describe the points of the polygon to draw each of the state shapes. You can create your own GeoJSON files at http://geojson.io and find free public ones online for example at https://geojson-maps.ash.ms/.
APIs are very useful for real-time data that changes frequently. In the projects for this app, you can use the OpenWeatherMap API to read in and display weather data for each state. Here’s a list of different public APIs that you can use in apps: https://github.com/toddmotto/public-apis.
Using and processing data sets in programs can have certain challenges. For example, the data may be incomplete or invalid or it may not have been entered in a uniform way with variations in spelling and capitalization. Cleaning data is a process that makes the data uniform without changing its meaning, for example, replacing all equivalent abbreviations, spellings, and capitalizations with the same word. Sometimes data translation and transformation is necessary to convert data from one format to another. When data is transformed using tools and programs, patterns can emerge, allowing us to gain insight and knowledge. More complex data operations such as clustering similar data or categorizing and labeling data can also help us to gain knowledge. However, the ability to process data depends on the capabilities of the users and their tools.
Tutorial
Start App Inventor with Data Map App Template. Once the project opens use Save As to rename your project.
Follow the video tutorial below or the text tutorial or the short handout to complete this app:
(TeacherTube Version)
Projects/Enhancements:
Your instructor may ask you to do some or all of the following enhancement projects.-
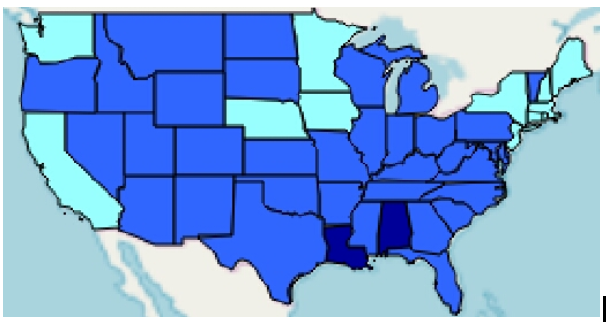 Data Visualization with Colors: Create a map visualization with 3 color shades for the states to show the differences in one of the data columns in the data spreadsheet. For example, in the preview video at the top of this lesson and the map image to the right, the states that had less than 10 death rate by firearms for every 100K people in 2016 are shown in light blue, the states that had between 10 and 20 deaths in medium blue, and the states that had the greater than 20 death rate by firearms in dark blue. To create a similar color scheme based on the data, add an if block and use the blue mutator to make it into a three-way choice: if/else-if/else block and set up the 3 ranges and use the Any Component block for set Polygon.FillColor.
Cite Your Source. When working with data, it is important to reference when and where the data comes from. If you haven't already, be sure to change the label's text property to say "Click on each state to see 2016 CDC Data".
Error Checking: You may run into errors with the data in this spreadsheet. Often we have to clean data or check for special conditions before we use it. Some of the values are empty in the spreadsheet which may cause errors. You should first save the data in a local variable and check that it is not empty text to avoid errors. - Procedure with Parameters: Our app would be even more useful if it let the user decide which data to present. Add 3 buttons to choose between different columns of data in the spreadsheet, for example Uninsured Rate, Firearms Death Rate, Overdose Rate. Refactor your code to add a procedure with parameters for the column number and the label of that column and have button click event handlers call this procedure. This procedure will update the map data (and color code it if you did extension 1) using a loop through the states like in File.GotText (except for the first two lines of code that set up the global data variable) but using your parameter variables. In fact, you can refactor your code so that File.GotText also calls this procedure with some default variables after setting up the global data variable in the first two lines of code. Note that if you choose data columns where the data is not in the same ranges (for example population), you may need more parameters to adjust the limit values where the color shades change in your if statements. You can also change the spreadsheet to include other data, see CDC State Data. Note that this procedure with parameters meets the requirements of the AP Performance task. Thank you to Mobile CSP teacher Jocelyn Humphries from John Jay High School in NY for this awesome coding idea!
- WebViewer: Note the last column in the data spreadsheet, contains a url for more information about the state on the CDC site. Use a webviewer to display a url that joins the base url https://www.cdc.gov with the url in the last column (#8) when each state is clicked by using the Map.FeatureClick event handler. To get the URL data, you can find the index of the state feature that is clicked by using an Index in List block with the feature that is clicked and the list FeatureCollectionStates.Features. Once you have this index, you can use it to select that state’s data from the global data list. Remember that this is a list of lists, so once you find the correct list of data for that state, you will need to use select again to find the URL data which is at index 8.
-
Weather API (Optional, requires registration to get a free API key): APIs can be used to read in real-time current data, for example the current weather report for a clicked state. Read about the OpenWeatherMap API here: https://openweathermap.org/current. Try clicking on this example: London Sample to get the current weather data in JSON format for London. OpenWeatherMap requires a registration key called appid. To get this free key, your instructor should follow the directions at https://openweathermap.org/appid and then tell you the key, for example appid=8bb5e8bedfe6fe3f1a44e0a2c04b6540.
To build the app, we need to build a url for each clicked state and pull out the main weather description. To make an API request, you will need a Connectivity/Web component in your UI (this is different than the WebViewer component).- Use a Map.FeatureClick event handler and set the Web.url to the API url like http://api.openweathermap.org/data/2.5/weather?q=state\&appid=yourAppId using a join to put in the state name which is the title of the clicked feature (using an Any Feature Component) and the appid (API key) that you got from your instructor (you can try the Mobile CSP one appid=8bb5e8bedfe6fe3f1a44e0a2c04b6540 but it may be blocked if too many people are using it).
- Then, call Web1.get. This will fetch that webpage and then go to the event-handler When Web1.GotText.
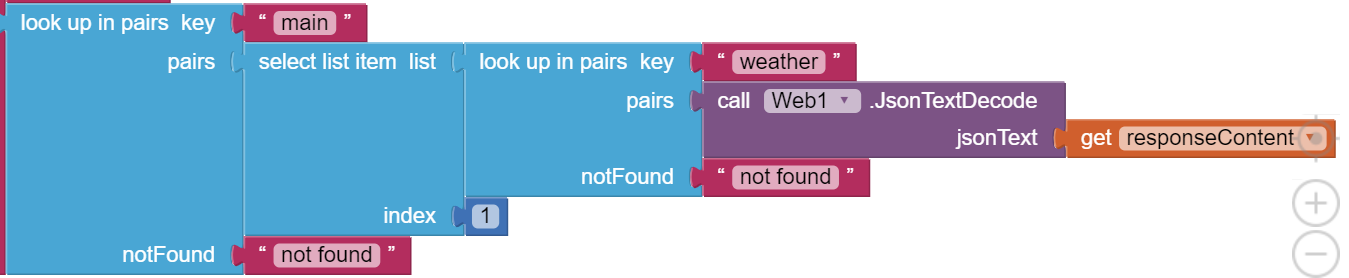
- In the GotText event handler, you will need to parse the result to find the weather main description, for example “clouds” below:
{"coord":{"lon":-78.39,"lat":43.1},"weather":[{"id":804,"main":"Clouds","description":"overcast clouds","icon":"04n"}. The List/Lookup in pairs block can pull out the weather key and then the main key in the result text. The following code will pull out this part of the JSON data returned from this API which you can then display in a label:
7.5.3. Summary
In this lesson, you learned how to:
7.5.4. Still Curious
- If you are curious about other APIs, here’s a list of different public APIs that you can use in apps: https://github.com/toddmotto/public-apis.
- Here is a great map visualization of Native Lands (https://native-land.ca/) and an API to use it.
7.5.5. Self-Check
Review the following vocabulary.
| CSV Files
JSON GeoJSON API cleaning data |
7.5.6. Reflection: For Your Portfolio
Answer the following portfolio reflection questions as directed by your instructor. Questions are also available in this Google Doc where you may use File/Make a Copy to make your own editable copy.