17.2. Tables of Records
Say you are conducting research about bike sharing for an internship in Washington D.C. You are given the Capital Bike Sharing dataset, contains information on Washington D.C.’s bike share program for 2011. The database has hundreds of thousands of records about every ride that anyone took and you would like to look for patterns in the data to understand questions like: “How long is the average ride?” and “Where is the most popular place to start a ride?”
In a database, the data is arranged in tables like the one shown below. This trip_data
table has all of the information about individual trips that were made. Each
row in a table is a record - here, each record is an individual trip someone made.
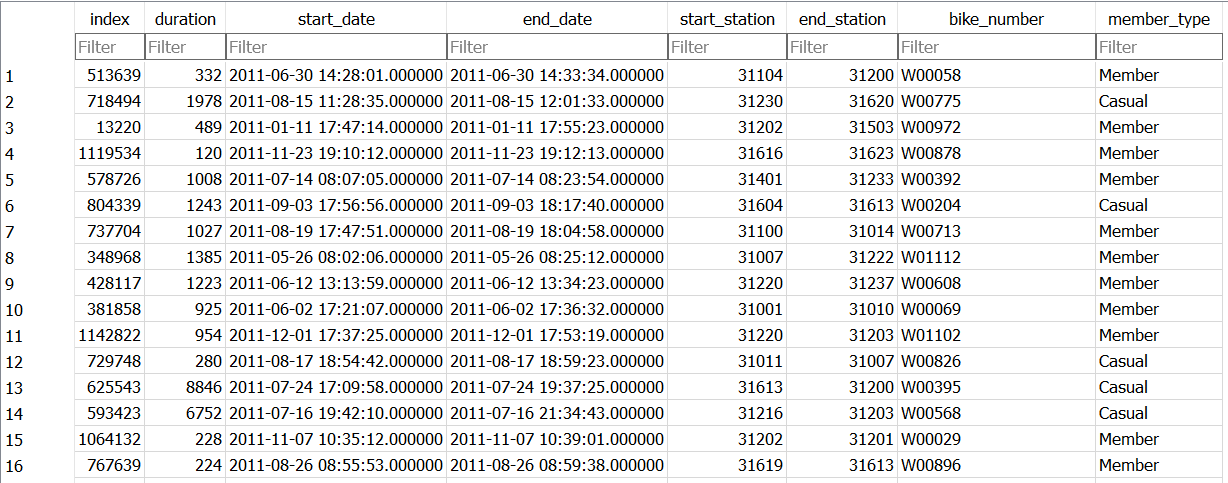
The columns are the pieces of data associated with each record. Here is a description of
the columns available in the trip_data:
Column Name |
Description |
|---|---|
index |
A unique number that identifies the trip |
duration |
The time in seconds of the trip |
start_date |
Date and time the bike was checked out |
end_date |
Date and time the bike was returned |
start_station |
Station number the bike was checked out at |
end_station |
Station number the bike was returned at |
bike_number |
Which bike was used |
member_type |
Type of user - Casual (one time), or Member |
Note
Don’t worry about memorizing all of the columns, you can check back here as needed.
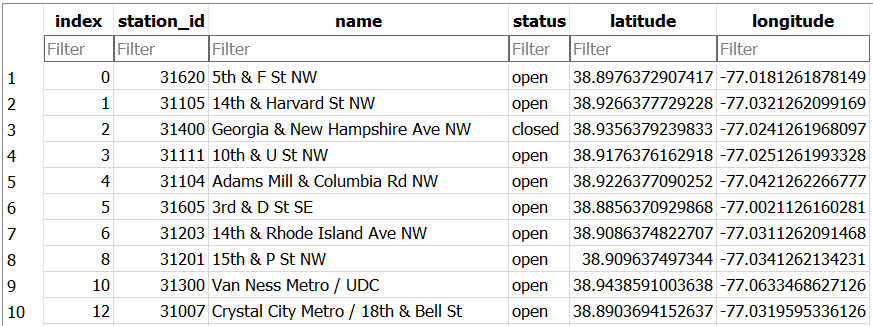
It has these columns:
Column Name |
Description |
|---|---|
index |
A number that identifies the record (1, 2, 3…) |
station_id |
A unique number that identifies the station |
name |
The name of the station |
status |
If the station is open or closed |
latitude |
Latitude (North-South position) of station |
longitude |
Longitude (East-West position) of station |