
6.11. A Turtle Bar Chart
Recall from our discussion of modules that there were a number of things that turtles can do. Here are a couple more tricks (remember that they are all described in the module documentation).
We can get a turtle to display text on the canvas at the turtle’s current position. The method is called
write. For example,alex.write("Hello")would write the string hello at the current position.One can fill a shape (circle, semicircle, triangle, etc.) with a fill color. It is a two-step process. First you call the method
begin_fill, for examplealex.begin_fill(). Then you draw the shape. Finally, you callend_fill(alex.end_fill()).We’ve previously set the color of our turtle - we can now also set it’s fill color, which need not be the same as the turtle and the pen color. To do this, we use a method called
fillcolor, for example,alex.fillcolor("red").
Ok, so can we get tess to draw a bar chart? Let us start with some data to be charted,
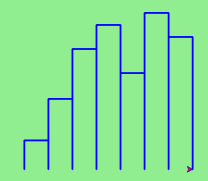
xs = [48, 117, 200, 240, 160, 260, 220]
Corresponding to each data measurement, we’ll draw a simple rectangle of that height, with a fixed width. Here is a simplified version of what we would like to create.
We can quickly see that drawing a bar will be similar to drawing a rectangle or a square. Since we will need to do it
a number of times, it makes sense to create a function, drawBar, that will need a turtle and the height of the bar. We will assume that the width of the bar will be 40 units. Once we have the function, we can use a basic for loop to process the list of data values.
def drawBar(t, height):
    """ Get turtle t to draw one bar, of height. """
    t.left(90)               # Point up
    t.forward(height)        # Draw up the left side
    t.right(90)
    t.forward(40)            # width of bar, along the top
    t.right(90)
    t.forward(height)        # And down again!
    t.left(90)               # put the turtle facing the way we found it.

...
for v in xs:                 # assume xs and tess are ready
    drawBar(tess, v)
It is a nice start! The important thing here was the mental chunking. To solve the problem we first broke it into smaller pieces. In particular, our chunk is to draw one bar. We then implemented that chunk with a function. Then, for the whole chart, we repeatedly called our function.
Next, at the top of each bar, we’ll print the value of the data.
We will do this in the body of drawBar by adding t.write(str(height))
as the new fourth line of the body.
Note that we had to turn the
number into a string.
Finally, we’ll add the two methods needed to fill each bar.
The one remaining problem is related the fact that our turtle lives in a world where position (0,0) is at the center of the drawing canvas. In this problem, it would help if (0,0) were in the lower left hand corner. To solve this we can use our setworldcoordinates method to rescale the window. While we are at it, we should make the window fit the data. The tallest bar will correspond to the maximum data value. The width of the window will need to be proportional to the number of bars (the number of data values) where each has a width of 40. Using this information, we can compute the coordinate
system that makes sense for the data set. To make it look nice, we’ll add a 10 unit border around the bars.
Here is the complete program. Try it and then change the data to see that it can adapt to the new values. Note also that we have stored the data values in a list and used a few list functions. We will have much more to say about lists in a later chapter.
This code is quite concise, but each height label is partly covered by the top
segment of its bar. Can you modifiy the
drawBar code, moving the label up slightly
but not changing the bar?
Hint: The label cannot be drawn during the polygon fill sequence.
Note
This workspace is provided for your convenience. You can use this activecode window to try out anything you like.