
What is a Sheet?
Fundamentally, a spreadsheet (also known as a sheet) is a table, or a matrix. It is a 2-dimensional way of viewing data (any form of information used for reference or analysis), through rows and columns. Spreadsheets are used to store, manipulate, and analyze data. You can create a spreadsheet using Google Sheets, which is simply referred to as Sheets throughout this textbook. Sheets is often used to store datasets, which are related sets of different data points. Below is the key terminology you need to know when using Sheets.
Basic Definitions
Cell: A cell is the smallest unit in a sheet. Each cell can contain any form of data.
Column: A column is a vertical group of cells, defined in Sheets with a letter.
Row: A row is a horizontal group of cells, defined in Sheets with a number.
Sheet: A sheet is a singular page in a Sheets document. A sheet contains its own table. You can create as many sheets within one document as as you like.
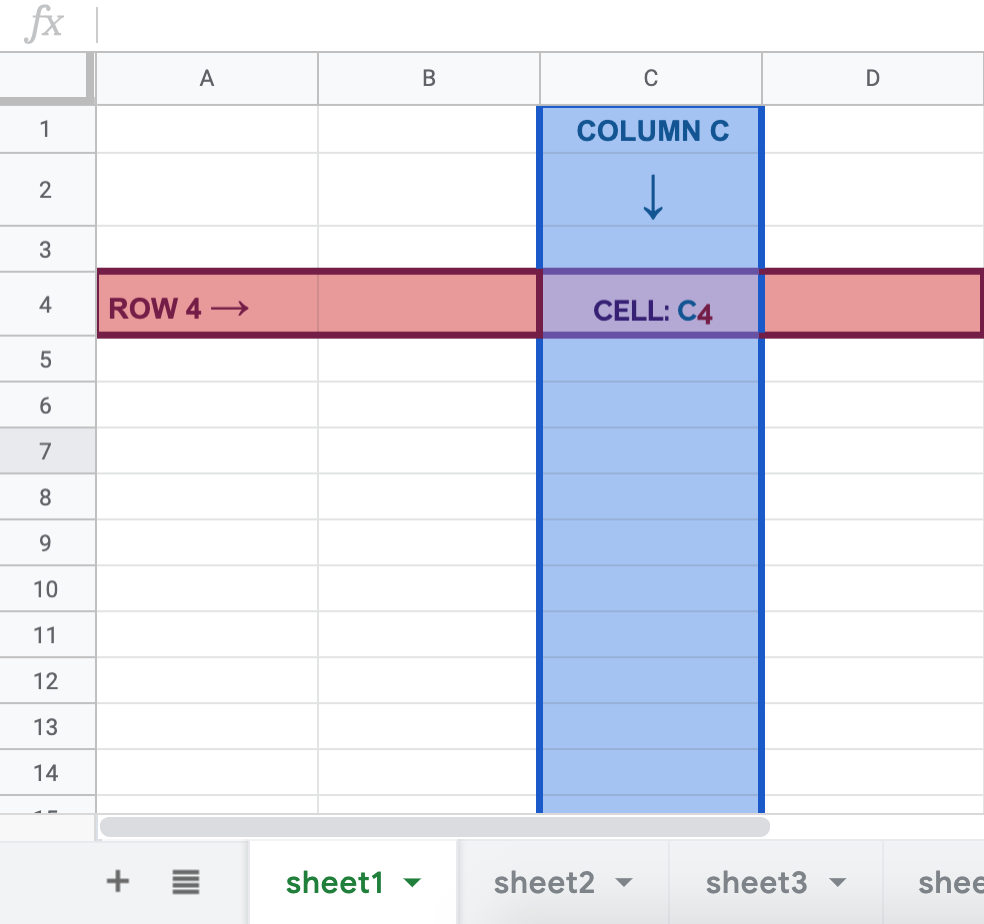
Note that a cell is usually defined by a letter and a number (in that order, by convention): the letter of the column and the number of the row. In the image below, the highlighted cell is C4, meaning the column is C, and the row is 4. The current sheet is called sheet1.
Example: Painters
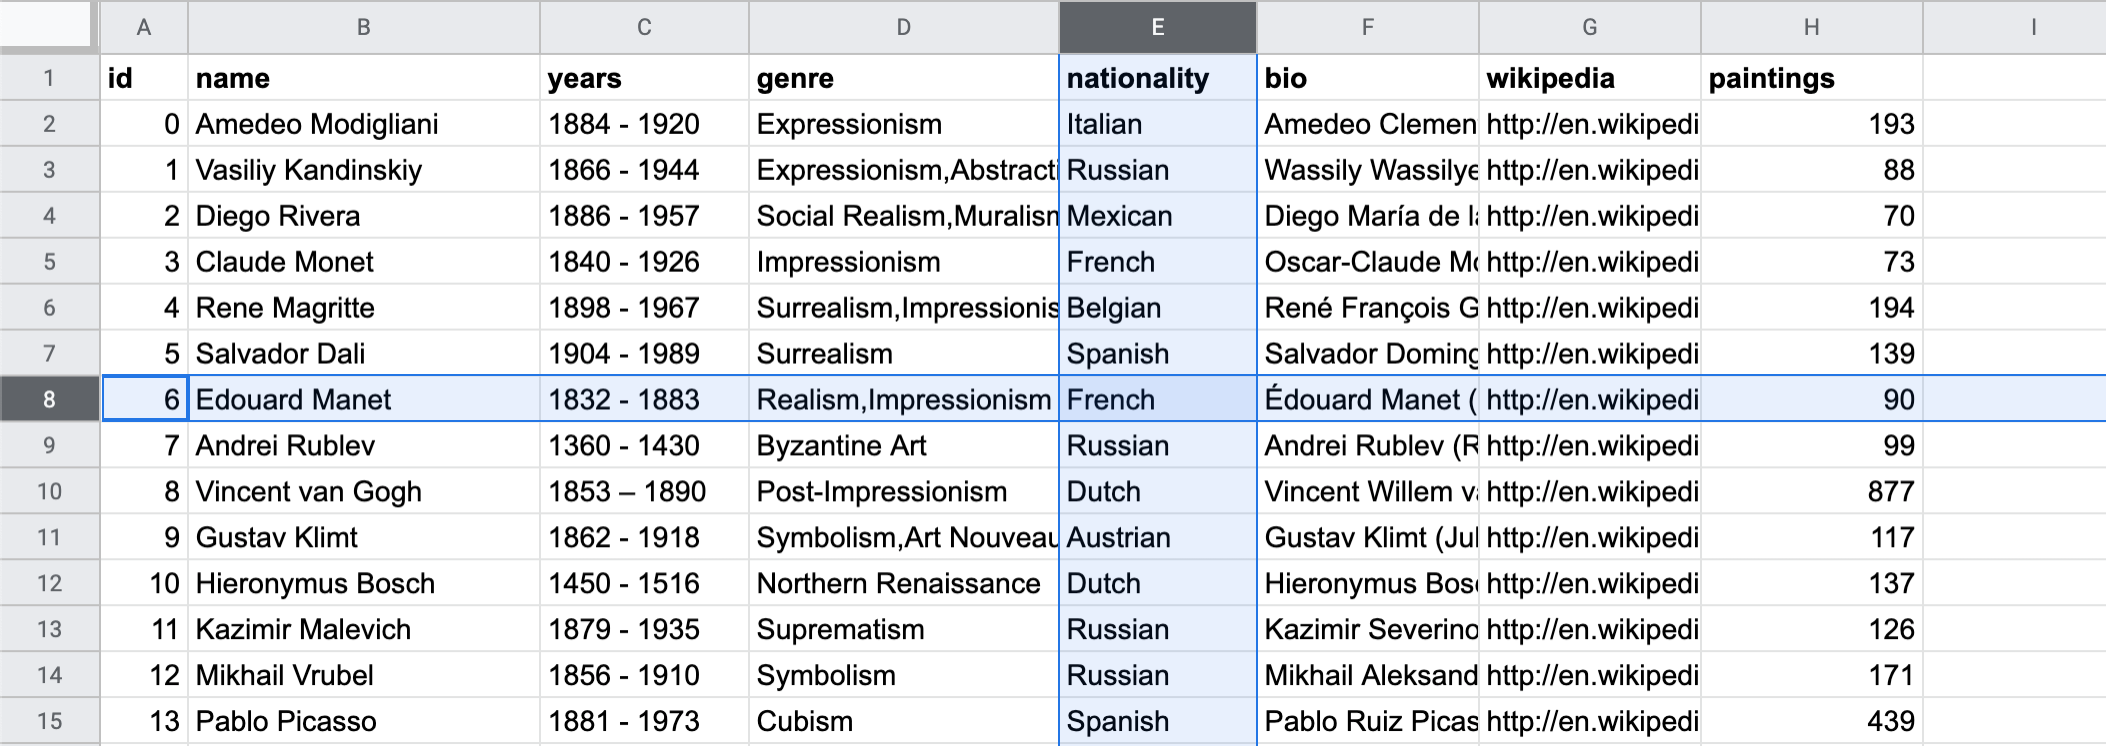
The definitions above might be a bit abstract. Sheets makes a lot more sense when there is data, so here is an example. In this dataset from Kaggle, there is information about 50 of the most prolific painters of all time.
In general:
Each row is an observation of the data. In this example, each row is a painter. For example, row 8 (where id = 6) tells you about Edouard Manet. If you were to add a new painter to this dataset, you would add a new row. You can add a new row by clicking “Insert” in the menu bar, and selecting either “Row Above” or “Row Below.”
Each column is an attribute of the data. In this example, each column tells you something about the painter (e.g. “name”, “years”). For example, column E tells you about a painter’s nationality. If you were to add a new attribute to this dataset (e.g. the number of children they had), you would add a new column. You can add a new column by clicking “Insert” in the menu bar, and selecting either “Column Above” or “Column Below.”
Each cell is an attribute of an observation. In this example, each cell tells you something specific about a given painter. For example, cell E8 tells you that Edouard Manet was French. If you have new information for an existing artist and attribute (e.g. you found out that Salvador Dali was French, not Spanish), you would update a cell.
Use this dataset to answer the following questions.
French
-
Incorrect
Belgian
-
Incorrect
Spanish
-
Correct
Italian
-
Incorrect
Q-1: What nationality was Pablo Picasso?