Logo image

Section 1.8 Graphics in Exercises

It is natural for exercises to have graphics. For example, an exercise might produce a graph of some kind, and ask the reader to extract some information from that graph.
If your WeBWorK server is version 2.16 or later, WeBWorK problems can process <latex-image> code. Here is an example.

Checkpoint 1.8.1. A static <latex-image> graph.

This image is a visual proof that \(\sum_{k=1}^{n}k\) equals what?
21 blue balls are arranged in a triangular formation, with one at the top, then a row of two, a row of three, and so on until a row of six; there is a seventh row with seven orange balls; one blue ball is highlighted, and two lines extend downward from that ball, one to the left and one to the right, parallel to the sides of the triangle, until they intersect two orange balls; the effect is that each of the 1+2+3+4+5+6 blue balls corresponds to one pair from the 7 orange balls
Answer.
\(\mathop{\rm C}\nolimits\!\left(n+1,2\right)\hbox{ or }\frac{\left(n+1\right)n}{2}\)

Checkpoint 1.8.2. A randomized <latex-image> graph.

These images may depend on the random seed. In this problem, the height and width of the rectangle are randomized.
Find the area of the rectangle.
a rectangle whose width is labeled 8 cm and height is labeled 6 cm
Answer.
\(48\ {\rm cm^{2}}\)

Checkpoint 1.8.3. A <latex-image> graph affected by <latex-image-preamble>.

This sample chapter’s <docinfo> has a <latex-image-preamble>. This exercise has graph styling that is affected by that.
What are the roots of this polynomial?
the graph of a polynomial that crosses the x-axis at -3, 0, and 3.
Answer.
\(-3, 0, 3\)

Checkpoint 1.8.4. Special characters.

This exercise is to test that special characters behave.
The code below has a printed dollar sign, a printed percent sign, a printed at sign, and a percent sign used as a comment marker.
this image has pictures of text with special characters like  %, and @
An older mechanism for creating images is supported and demonstrated here.
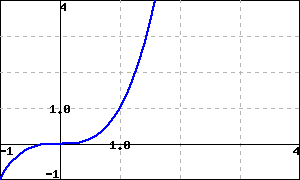
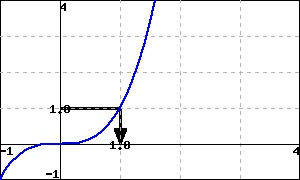
Checkpoint 1.8.5. Solve using a graph.

The graph below is a graph of \(y=f(x)\text{.}\) Use the graph to solve the equation \(f(x)=1\text{.}\)
a plot of a curve on a cartesian set of axes; the x axis ranges from -1 to 4, and the y-axis ranges from -1 to 4; the curve enters from the left, below the x-axis, and curves upward and to the right until it reaches the point (0,0); from here it continues predominantly rightward for a bit, bending slightly upward more and more as it progresses; it passes through the points (1,1) and (1.25992,2) before leaving the graph moving more and more upward and to the right.
Answer.
\(\left\{1\right\}\)
Solution.
The graph reveals that the solution set to \(f(x)=1\) is \({\left\{1\right\}}\text{.}\)
a plot of a curve on a cartesian set of axes; the x axis ranges from -1 to 4, and the y-axis ranges from -1 to 4; the curve enters from the left, below the x-axis, and curves upward and to the right until it reaches the point (0,0); from here it continues predominantly rightward for a bit, bending slightly upward more and more as it progresses; it passes through the points (1,1) and (1.25992,2) before leaving the graph moving more and more upward and to the right; a horizontal line segment moves rightward from y=1 on the y-axis until it reaches a point on the curve; a vertical line segment moves down from this point to x=1 on the x-axis.

Exercises Exercises

Exercise Group.

This exercisegroup has a <latex-image> image in its introduction. In standalone versions of the exercise, this image should be repeated.
1.
Find \(D\) when \(L=4\) and \(W=3\text{.}\)
Answer.
\(5\)
Solution.
2.
Find \(D\) when \(L=12\) and \(W=5\text{.}\)
Answer.
\(13\)
Solution.
You have attempted of activities on this page.