Pattern Recognition & Machine Learning
Decision Trees, Neural Networks and Nearest Neighbor algorithms are all similar in that they are algorithms for recognizing patterns - for looking at incomplete information and making judgments based on it. But Decision Trees and Neural Networks share another characteristic: they are both forms of machine learning. In a machine learning algorithm, it is not up to a human to specify every detail of how to solve a problem. Instead, a programmer sets up a system that allows the computer to “learn” how to categorize data by looking at examples. These training examples are inputs for which the desired output is known. The computer works backward from these samples to adjust parameters in the algorithm it is running so that it produces the desired output.
This kind of approach makes lots of sense when we are dealing with problems for which human experts “know” the right answer but can’t cleanly describe a set of rules to get to that answer; things like “does this picture have someone with sunglasses in it?” Instead of people having to explicitly describe how to solve the problem, the machine learning algorithm can be presented with a series of examples (pictures for which a person has already decided yes or no sunglasses) and figure out through trial and error what works.
Decision Tree Development
This video shows using a program to develop a decision tree that decides if someone will read or skip a given email. If an email program wants to figure out which items to send to your junk mail folder, and which ones to mark important, it might do so by developing a decision tree like this one.
The human input to the process is the training data and the details that the system considers for each example. (In the email example in the video, someone had to decide that email length would be a criteria and the possible values were short or long). The computer’s contribution is to figure out how to arrange those details into a decision tree to best categorize examples.
You do not have to actually run the program yourself, so focus mostly on how the tree is developed, what information it communicates, and how to read it. If you want to try running the program yourself, you can find it here.
Optional: Neural Network Learning Examples
Neural networks “learn” by adjusting the weights of connections between nodes. They see an example and then guess at the correct output; if they get it right, they strengthen the existing weights; if they get it wrong, they modify the existing weights to make that answer less likely in the future. (There are multiple ways to do these modifications, if you are interested, google “neural network training algorithms”). Here are a few websites you can check out to see this happening in practice:
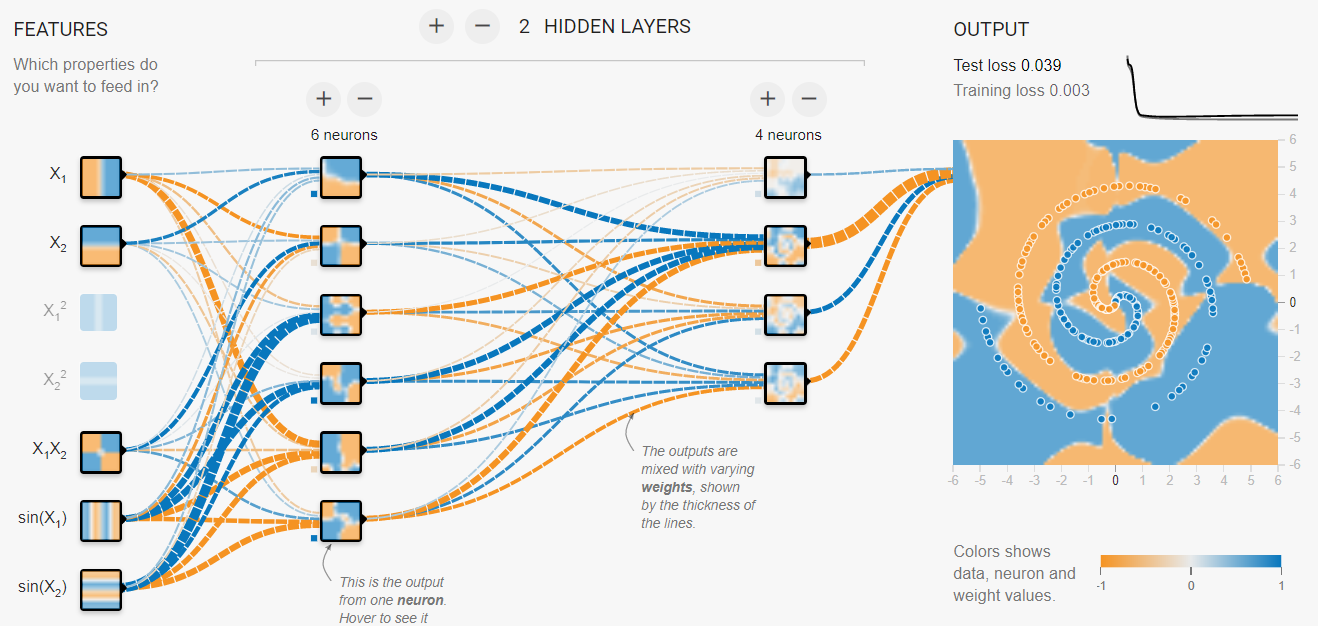
This website has a neural network simulation that you can watch go through the learning process. Hit the “Play” button on the page and watch as the network learns to categorize a 2D plane into “orange” and “blue” areas. The weights between nodes are illustrated by the thickness of the lines connecting them. Here is what it looks like:
This website does not show the actual neural networks, but it does show the output as neural networks learn to do things like recognize objects in images or learn to read handwriting.
Optional: Sigmoid Functions
Nine Algorithms talks about how in a neural network we may have nodes that output a value between 1 and 0. If the inputs far exceed the threshold the output is 1, if they are well short of the threshold the output is 0, but if it is close, the output may take on an intermediate value. A little more detail may help this process make sense.
Usually, a sigmoid or “S” shaped function is used to calculate the output of a neuron based on its inputs. One possible function is shown below. The input to the function (x) would be the sum of weighted inputs minus the threshold. So if inputs to a neuron totaled 1.9 and the threshold was -4, the x value would be -2.1. That means the output of the neuron would be about 0.1.
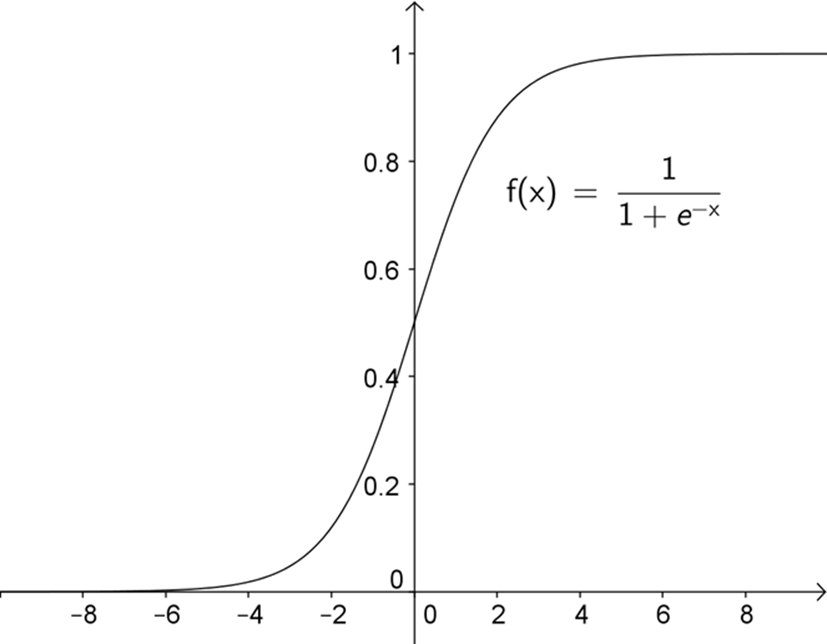
x-axis represents the amount the sum of inputs exceeds the threshold by. y-axis is output value.