
Using Python in an IDE
Finding Your IDE
There are many different ways to us Python and other languages on a computer. For this example, we will be using an IDE called PyCharm, but there are many other options. A few of the IDEs you can use are listed below. IDE stands for “Integrated Development Environment.” Most good IDEs will consist of a source code editor that will let you write and manipulate the code, a debugger to help the user identify and solve issues within the code, and a compiler that translates your low-level code to high-level code or even binary to optimize the performance of your code.
- https://www.jetbrains.com/edu-products/download/#section=pycharm-edu (This is
the IDE that will be shown here for the example, but we encourage you to try different ones and find the one that suits you.)
- https://www.eclipse.org/; http://pydev.org/ (Eclipse in an IDE for multiple
different platforms/languages and pydev is a plug-in to use Python on Eclipse.)
- https://visualstudio.microsoft.com/vs/community/ (Visual Studio Community is
a very flexible and modular IDE with great debugging tools.)
If you would like to browse through even more options, there are many others you can choose from!
Downloading Your IDE
Each download may look different, but here is the general install proccess for PyCharm:
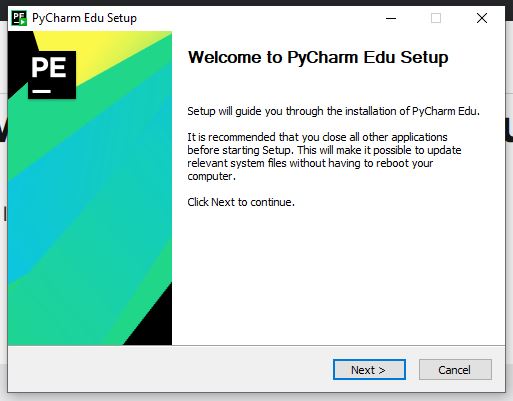
Figure 1
Save your install in a path that best works for you. Here we will save it in the default path.
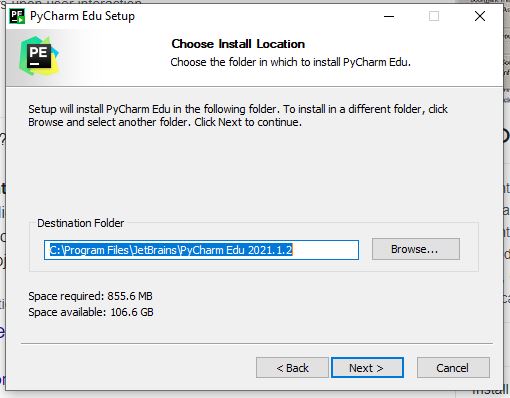
Figure 2
Select the installments that word best for your computer. Here, the selection for Add launchers dir to the PATH helps the computer to recognized automatically which folder should be opened in PyCharm.
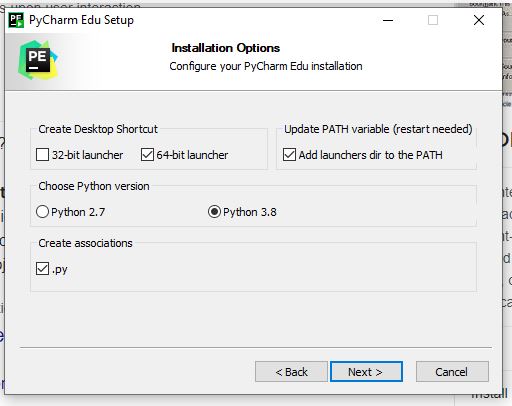
Figure 3
Only import settings settings to your IDE if you have set them up previously. For new installs, not importing settings is most likely best.
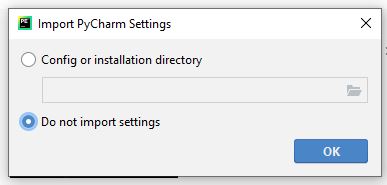
Figure 4
Once you have everything up and running, your home screen should looks something similar to this!
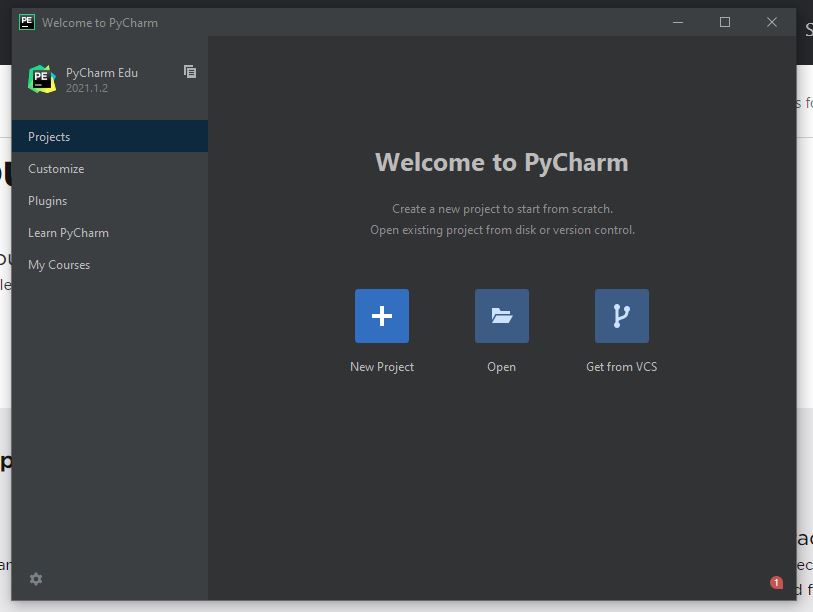
Figure 5
The last thing you need to do is to configure your interpreter that will be used in your IDE. While some downloads will automatically configure this for you, PyCharm needs the interpreter to be configured after opening your first repo. If you have a repo you would like to clone, then press on New Project and then navigate to the options for Base Interpreter and select the file path that your saved your Interpreter in with your download. Here, clicking Make available to all projects will set the base options for all new projects to use this Interpreter.
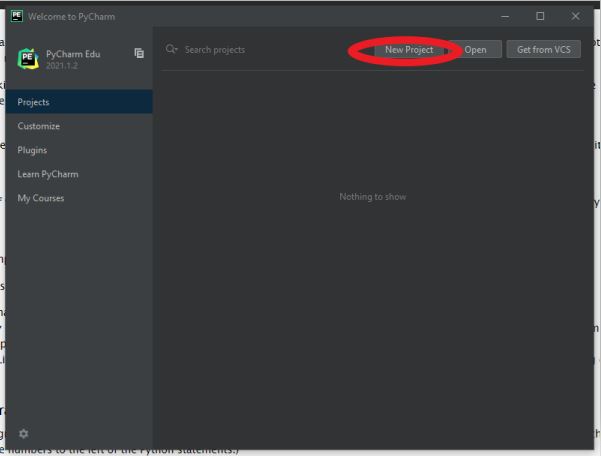
Figure 6
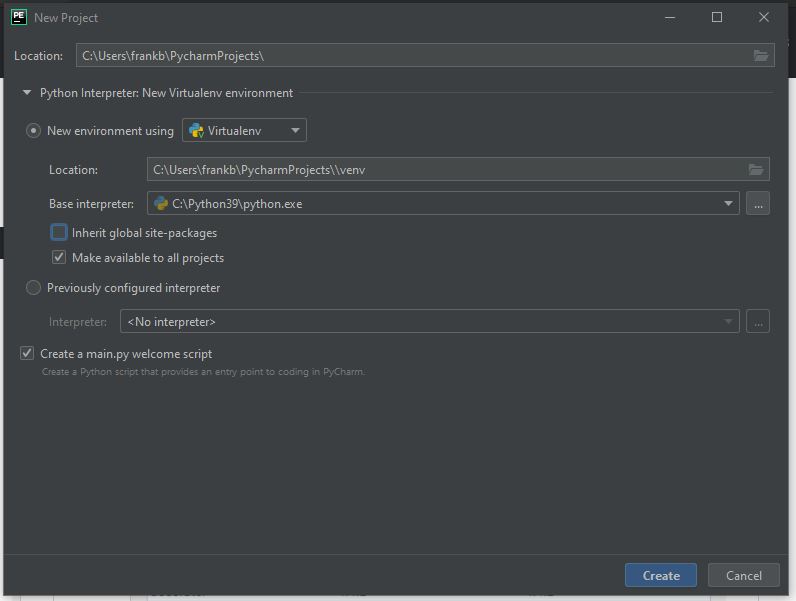
Figure 7
If you already have a repo on your local computer and would like to set up the interpreter from there, you can navigate to File -> Settings -> Project <project name> -> Python Interpreter
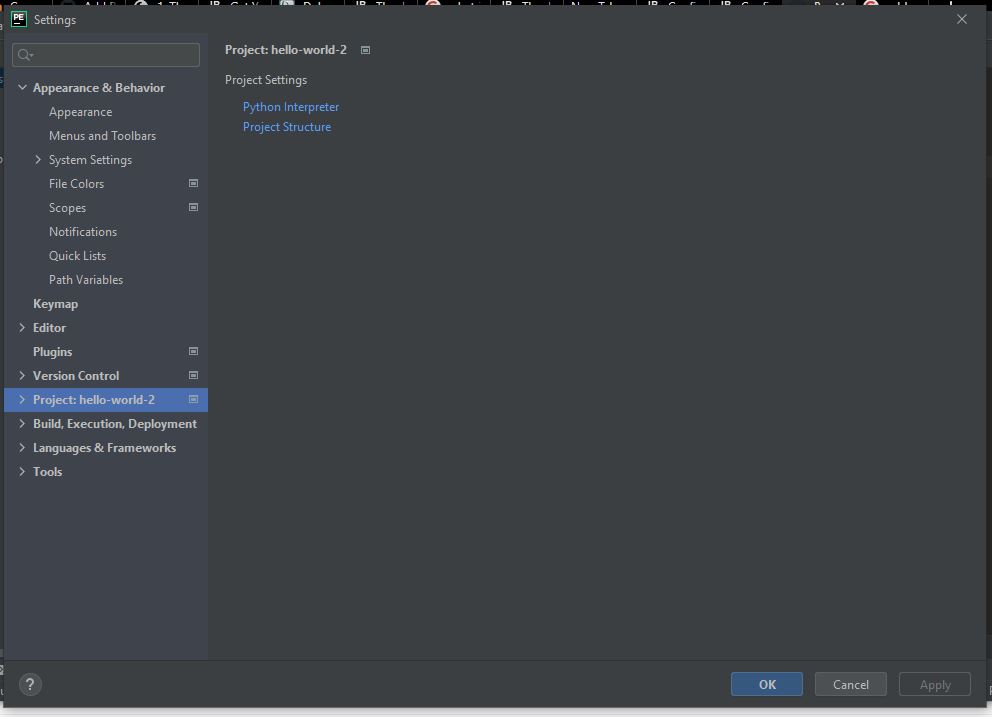
Figure 8
Using an IDE
Now you are ready to code in an IDE, just make sure you find the ways that your IDE uses to save, add, pull, commit, and push your work. For instance, in Pycharm, you can right click on the code. From there, you can Run the code, Debug the code, use the Git option to add, commit, and push your work, and so much more Playing around with it and figuring out new things is the best part!
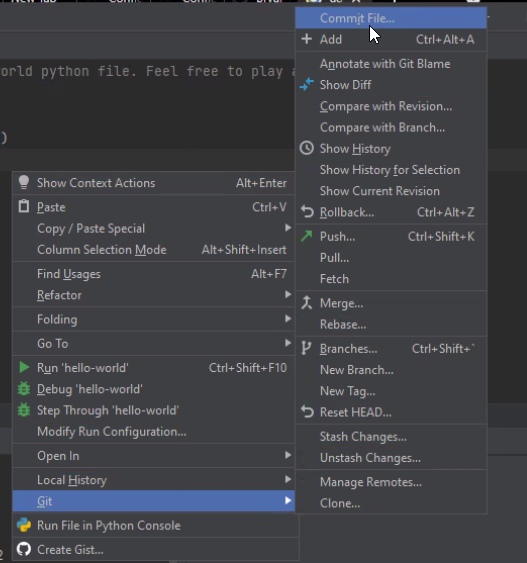
Figure 9
Debugging with an IDE
Using an IDE with a debugger and knowing how to use it is a powerful tool. It makes usually debugging much easier to manage because it has tools to “step” through the code to run your code line by line. It’s very similar to running your code through Python Tutor, which is a free online tool that helps you understand what happens in every single line of code.
Keep in mind that most IDEs will look a little different in tools, but they will have mostly similar tools, like the debugging button.
In PyCharm, your debugging tool will look like this:

Figure 10
For more information on PyCharm debugging, you can follow ‘this link <https://www.jetbrains.com/help/pycharm/part-1-debugging-python-code.html#step>__’. Your debugging button will give you options for more tools, like “step-through”, which allows you to go through the code line by line. This usually allows for easier error-finding.
Breakpoints allow you to set a point where the code stops executing. Doing this helps section off the code to make sure it functions. Note that breakpoints can be added at any time of the debugging process.
If errors display in the console, they will let you know which line is the source of your troubles, usually at the end of the errors list. Some code or descriptor is given to help you fix the issue, but sometimes they are cryptic.

Figure 11
Remember that when coding, the console is different from the script. The console can display results and you can type line-by-line code. It will remember while you’re in the IDE, but you can’t save it the way you can save scripts. Above you will see the difference between where the script and console is normally on an IDE. When you run a program, it will only compile everything on the script and run that, not what is on the console.
Working directly in the interpreter is convenient for testing short bits of code because you get immediate feedback. Think of it as scratch paper used to help you work out problems. Anything longer than a few lines should be put into a script.