
Chapter 3: Tables of Data
In this class, we started out talking about how characters were represented on the computer, and how that choice (e.g., between ASCII and Unicode) can be a barrier to some people’s access to computing. We considered how computers might recognize and generate sentences, and about the challenges of understanding different dialects of English with the same language model. We then moved to the Internet and the Web, tracing its history and how grounded it was in English and male culture (e.g., the history of BASIC at Dartmouth). We wrote programs to pull data out of the Web (e.g., pulling out URLs and web-scraping) and to generate HTML for the Web. In this latest section of the course, we have written programs to analyze data from the Web.
Section 1: Billionaires
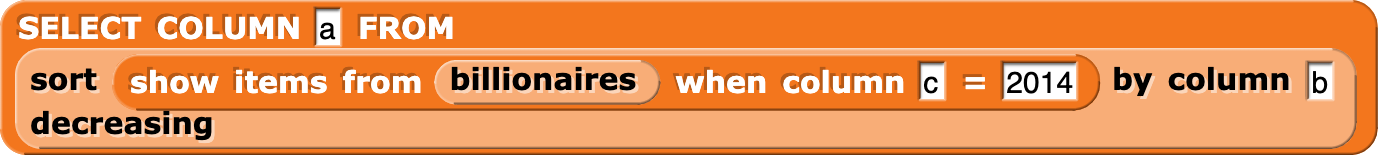
In this class, we have been writing Snap programs to take apart and analyze CSV files. In this ebook, we’ll be using the databases and blocks found in the Database Microworld with Titanic project. For example, here’s a script that selects the billionaires from 2014, sorts those billionaires in terms of their rank (in column B), then selects just the names.
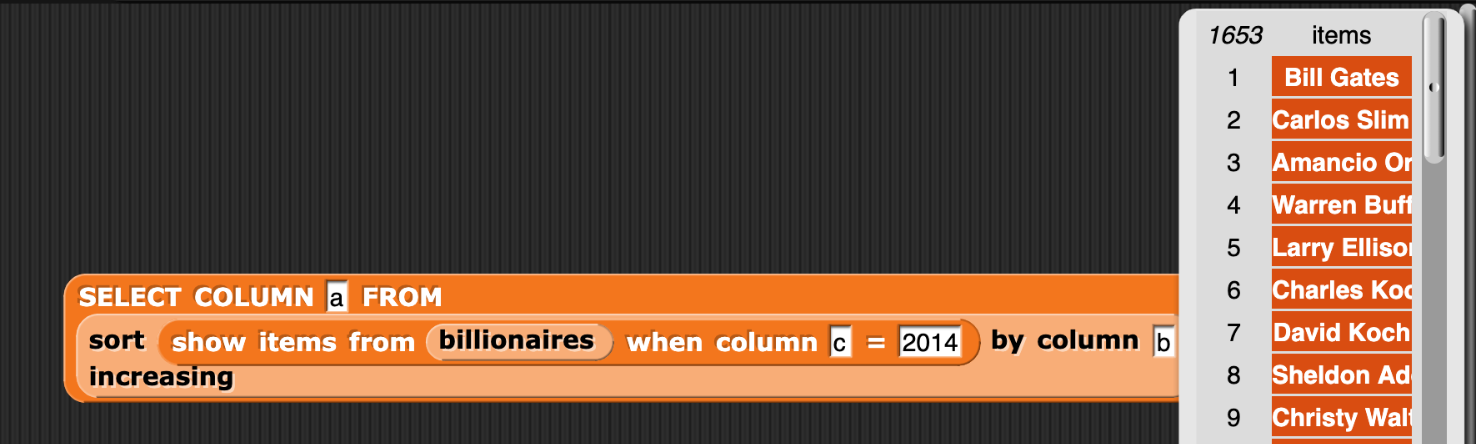
The list is long – 16543 names. We can get Snap to show us all of them. Here’s what the top of that list looks like.
We can also describe the same script as a pipe where the billionaires are first selected, then sorted, and then the names selected out.

The SQL Version
In the database world, these kinds of queries are typically written in SQL, which stands for Structured Query Language. SQL is a domain-specific languages for managing data in tables. A database table is different than a CSV file. One difference is that columns in a database table usually have a type. You might store numbers in one column, dates in another, and text in yet another. Once set up, you may not put text in a column that can only hold numbers. Click ‘Run’ to generate a random sentence.
Database tables can be set up to have indices. An index (which can be one variable or a set of variables) should be unique for each row of a database. For example, an ID number associated with a customer or office could be an index. Access via an index is especially fast, much faster than searching the CSV table for information.
Here is the SQL code that does the same thing as the Snap programs above. Click the Run button to execute it.
Try answering these questions about the code above.
- It's an error.
- No, it will work.
- You get all columns, not just name.
- Yes, asterisk means to match all of the column names.
- You multiply all the values together.
- No, it's not about mathematics.
Q-2: What do you think will happen if you replace name by * above? (Yes, it’s completely fine to go ahead and TRY it.)
- You'll get an error because you have to specify a year.
- No -- in fact, you don't have to have a WHERE clause at all.
- You'll get an error because you need to always use AND in a WHERE clause.
- No, you can use AND or OR, or neither.
- You'll get the top 9 rankings from every year in the database.
- Exactly right -- try it!
Q-3: What will happen if the last line was just where rank<10; (no year)?
- It will run the query across all tables in the database.
- No, the table name must be specified.
- The table billionaires will be assumed.
- No, because you might have two tables in use (e.g., for a join)
- You will get an error.
- Yes, the error is `no tables specified.` (But you probably tried that and found out already.)
Q-4: What happens if you delete line 2?
Section 2: Titanic
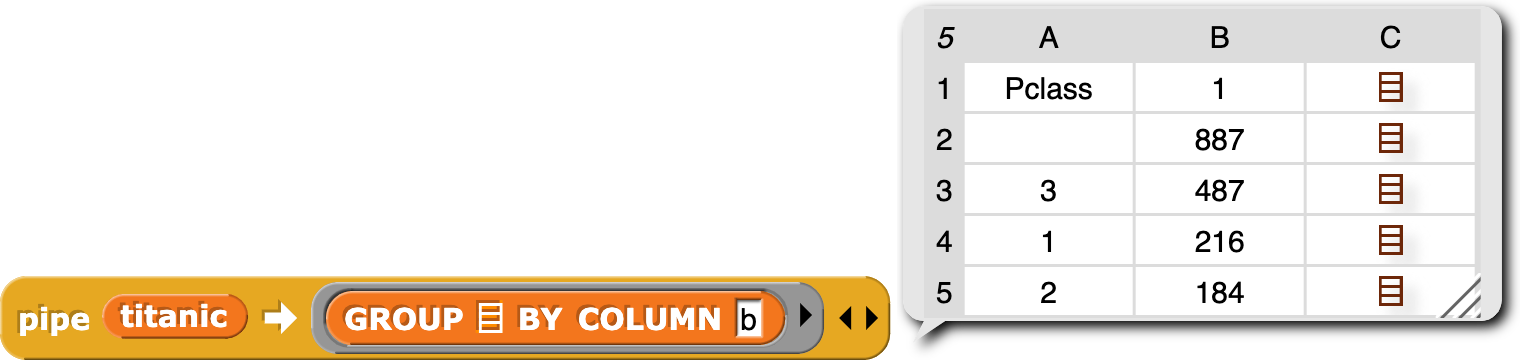
You may remember that we also did several analyses with the list of passengers on the Titanic. For example, here is a grouping by passenger class. This is how many there were in each class:
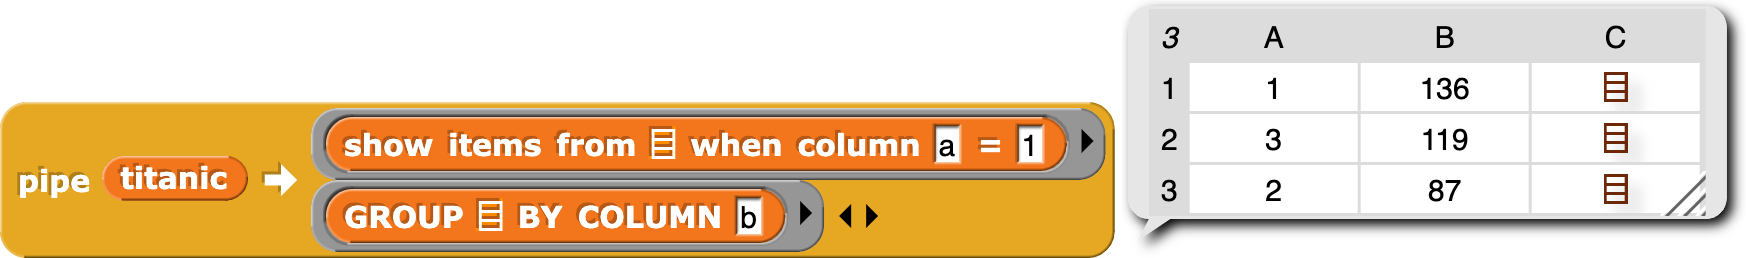
In this second example, we can first select by whether or not the passengers survived, and then group by class.
Computing the average for each class is left for you to do.
Here are each of these analyses, in SQL. Press Run to execute each of them.
The SQL Versions
Here are some questions about each of these:
- It's the index value for this database.
- Maybe it could be, but it isn't here.
- It's likely unique.
- That is why we did it.
- You must always count something when grouping
- It's not strictly necessary, but if you don't, you just get one name per class. Try it!
Q-7: Why are we counting name?
- True
- Not really. This is a count of the number of parties on the Titanic.
- False.
- Right. If you look, each row has the number of adults and children. Besides, we can't be sure that the passenger list is right since some people may have got off before crossing the Atlantic.
Q-8: True or False: This is a count of the number of people on the Titanic.
Names on the Titanic
One of the more interesting analyses that we did with the Titanic data was to look at the most common first names of men vs. women.
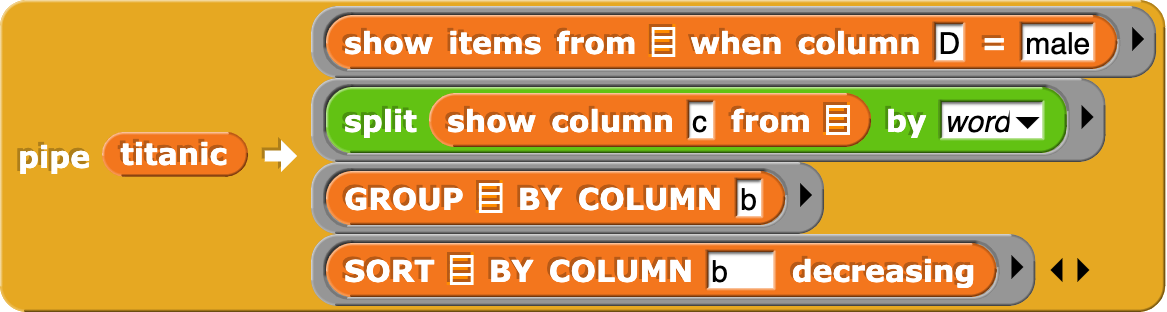
This turns out to be much more difficult in SQL. SQL can generate substrings, but it can’t easiliy split by word. The Snap version is splitting by wording, then grouping and sorting the result.
Here’s an example that’s getting close – picking out the first three characters from all male names on the Titanic.
Now, we can see adults (“Mr.”) vs children (“Mas” for “Master”). But there’s not an easy way of getting the second word.
- Yes, it's required.
- Right, because you could have several SQL statements in a single query.
- Yes, but it's optional.
- No, it's required.
- No, you could leave it out.
- Try it -- it won't work right.
Q-10: Is that semi-colon at the end really necessary?
- True
- Strictly speaking, it is. It's considered a domain-specific language.
- False
- It is a programming language, but it can't do much. It's considered a declarative language because you declare what you want.
Q-11: True or False: SQL is a programming language.