1.1. Introduction
This chapter will cover the definition and practice of data science. It will explore the history and current state of the discipline, explaining how data science began and where it will be going in the future. We will also explore how data science leverages data analysis and data visualization.
1.1.1. Learning Goals
Understand the importance of data collection and its implementation.
Gain awareness of how broad data collection is in all subjects.
Gain an introduction to what a Data Scientist does.
Understand and know the purpose of all the steps in the Data Science Pipeline.
Understand what it takes to gain and better skills: Learning Zone vs Performance Zone.
Learn the difference between Data Science and Data Analytics.
1.1.2. Learning Objectives
Be able to identify different steps along different data science pipelines, recognizing all the previous and future steps.
Be able to identify if you are in a performance zone or learning zone and transition between them as necessary.
Be able to effectively navigate the How to Think Like a Data Scientist book.
1.1.3. What Is Data Science?
In 2016 a study reported that 90% of the data in the world today has been created in the last two years alone. This is the result of the continuing acceleration of the rate at which we store data. Some estimates indicate that roughly 2.5 quintillion bytes of data are generated per day; that’s 2,500,000,000,000,000,000 bytes! By comparison, all the data in the Library of Congress adds up to about 200 TB, merely 200,000,000,000,000 bytes. This means that we are capturing 12,500 libraries of congress per day!
The amount of data that Google alone stores in its servers is estimated to be 15 exabytes (15 followed by 18 zeros!). For those of you who remember punch cards, you can visualize 15 exabytes as a pile of cards three miles high ,covering all of New England. Everywhere you go, someone or something is collecting data about you: what you buy, what you read, where you eat, where you stay, how and when you travel, and so much more. By 2025, it is estimated that 463 exabytes of data will be created each day globally, and the entire digital universe is expected to reach 44 zettabytes by 2020. This would mean there would be 40 times more bytes than there are stars in the observable universe.
1.1.4. What does it all mean?
Often, this data is collected and stored with little idea about how to use it, because technology makes it so easy to capture. Other times, the data is collected quite intentionally. The big question is: what does it all mean? That’s where data science comes in. Data science is an emerging and interdiciplinary field that brings together ideas that have been around for years, or even centuries. Most people define data science as “an interdisciplinary field about processes and systems to extract knowledge or insights from data in various forms”.
Data science has spawned many new jobs in which people and computers extract valuable insights from this data. These range from the simple scaling of functions that existed previously, to completely new jobs processing data that was never previously captured. For example, the owner of a general store 100 years ago kept a log, both on paper and in their head, of the items their customers purchased and how those items varied with the seasons. Based on this knowledge, they would decide how many of each product to order to meet their customers’ needs, while keeping their stock to a minimum. With data science, this job can be done on the scale of thousands of supermarkets spread across the country and can factor in a myriad of signals that would have been too hard for the store owner to track, such as unemployment, inflation, or even weather forecasts.
At the other end of the spectrum, we are now able to track the pressure applied to various points on the sole of an athletic shoe with a precision that was impossible just a few years ago. This allows manufacturers to design more efficient and comfortable footwear understanding this data.
1.1.5. What does a data scientist do?
1.1.6. Data Science in a Liberal Arts Context
As an interdisciplinary field of inquiry, data science is perfect for a liberal arts college as well as many other types of universities. Combining statistics, computer science, writing, art, and ethics, data science has application across the entire curriculum: biology, economics, management, English, history, music, pretty much everything. The best thing about data science is that the job of a data scientist seems perfectly suited to many liberal arts students.
The best data scientists have one thing in common: unbelievable curiosity. - D.J. Patil Chief Data Scientist of the United States from 2015 to 2017.
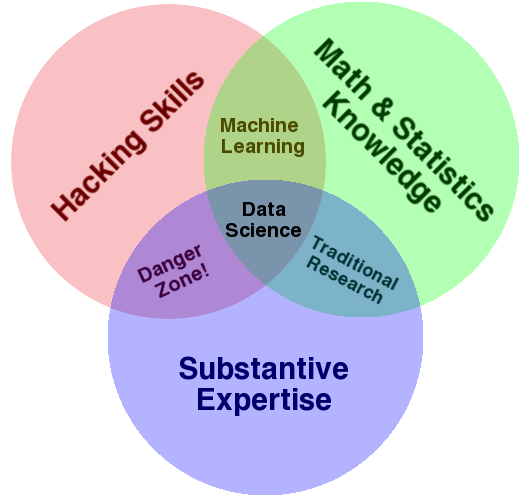
The diagram below is widely used to answer the question “What is Data Science?” It also is a great illustration of the liberal arts nature of data science. Some computer science, some statistics, and something from one of the many majors available at a liberal arts college, all of which are looking for people with data skills!
According to Eric Haller, Executive Vice President & Global Head, Experian DataLabs (a global information services company), when interviewed by the Chicago Tribune:
A data scientist is an explorer, scientist, and analyst all combined into one role. They have the curiosity and passion of an explorer for jumping into new problems, new datasets, and new technologies. They love going where no person has gone before in taking on a new approach to taking on age old challenges or coming up with an approach for a very new problem where nobody has tried to solve it in the past.
They can write their own code and develop their own algorithms. They can keep up with the scientific breakthrough of the day and regularly apply them to their own work. And as an analyst, they have a penchant for detail, continually diving deeper to find answers. Finding treasure in the data, analysis, and the details give them an adrenaline rush.
Our data scientists tend to operate with a noble purpose of trying to do good things for people, businesses and society with data.
However, all of this exploration and analysis means nothing if you cannot communicate it to people. In a Harvard Business Review article by Jeff Bladt and Bob Filbin entitled: A Data Scientist’s Real Job: Storytelling, they elaborate:
Using Big Data successfully requires human translation and context whether it’s for your staff or the people your organization is trying to reach. Without a human frame, like photos or words that make emotion salient, data will only confuse, and certainly won’t lead to smart organizational behavior. - Harvard Business Review
Stories are great, but in data science, you need to make sure they are true, especially when you are dealing with stories about numbers. In an article entitled The Ethical Data Scientist, the sub-title really tells the story: People have too much trust in numbers to be intrinsically objective. The better known phrase is that “Statistics don’t lie, but statisticians sometimes do.” The challenge for the data scientist is to avoid the trap of choosing the statistics that only tell the story they want to tell.
The ethical data scientist would strive to improve the world, not repeat it. That would mean deploying tools to explicitly construct fair processes. As long as our world is not perfect, and as long as data is being collected on that world, we will not be building models that are improvements on our past unless we specifically set out to do so.
1.1.7. The Data Science Pipeline

One of the primary goals of this textbook is to familiarize you with the data science pipeline. That is the series of steps you will go through as you seek to analyze and communicate with data. There are many steps in the pipeline and as you can see; the pipeline is anything but a linear process. Doing data science is a very iterative process whereby you will often repeat previous steps because of something you learn in later steps. This is part of the exploratory nature of data science. There is not a single formula for success, or a single process that works for every data set. Let’s look at each of the steps.
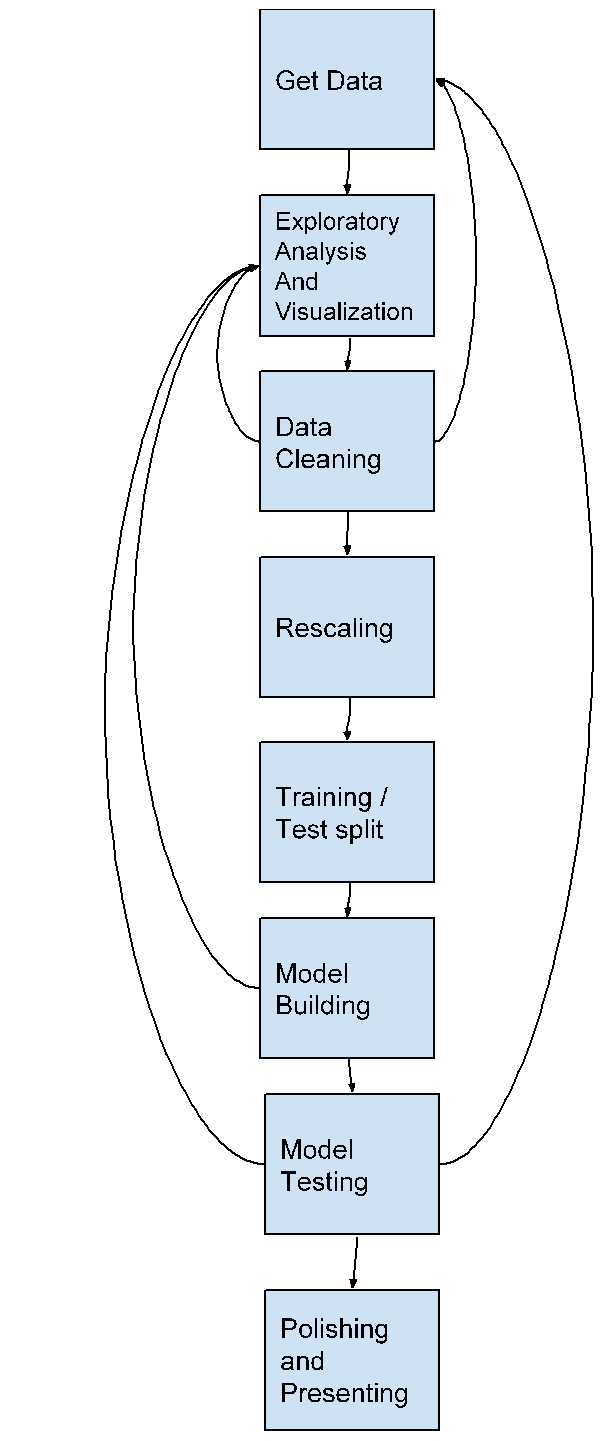
Get Data: Acquiring data can come in many forms. Data is sometimes found in a simple file, or in relational database, from a web based interface, or in some unstructured form that you will scrape from a web page. Many times, a project will require data from more than one of these sources.
Exploratory Data Analysis and Visualization (EDA): It’s virtually impossible to glance at a data set and comprehend what it is trying to tell you. So you need to spend some time exploring and getting to know the data. There are lots of questions you can ask about any data set that will help you in this task. What is the largest/smallest of X? What is the average of Y? What is the distribution of Z? In each module of this book, we will spend a good amount of time on the EDA task introducing you to these questions.
Data Cleaning: As you explore the data, you will discover missing pieces, outliers, data that was entered incorrectly, or that is even of the wrong type. You will learn techniques for dealing with all of these problems.
Rescaling: Sometimes, we want to look at data in its raw and unchanged form, but other times, having data that includes pricing data, along with age data, along with distance measurements can cause big problems. In these cases, we will learn ways to rescale the data so that it works with the algorithms we want to use.
Training / Test split: In a machine learning project, we divide up our data into a training set that we will work with for model building, and a test set that we hold back and only use for test purposes. This is much more realistic because we frequently want to use our machine learning system to make predictions in new situations that we have never encountered. It is not very interesting to predict things that we already know.
Model Building: Building models is an exciting part of data science. In this class, we will rely on libraries that are well tested rather than writing algorithms from scratch. In particular, we will use the amazing Scikit Learn library of models.
Model Testing: Once the model is built, we need to test it to see how well it performs using our test data. Sometimes things work well, and sometimes we need to go back to the drawing board to build a completely different model using a completely different algorithm.
Polishing and Presenting: Finally, when all is tested and validated, you will need to present your results. This may take the form of an infographic, an animated visualization, a video, a series of graphs that you narrate with text, or in a presentation. This is often the most important part of the process! It doesn’t do anyone any good for you to spend weeks understanding what the data is telling you if you can’t turn that into a form of communication that connects with your audience, whether it’s your peers, your boss, your parents, or your customers.
1.1.8. Data Science in This Text
In this text, we will use Google Sheets and Python to apply data science skills to the exploration of data about the world around us. We will use programming skills like if statements, for loops, and functions that are core to Python, we will add some specialized tools to allow us to process large datasets both easily and quickly. These are the tools that researchers and professional data scientists use to perform their work.
As we dive into data science, you will notice that the format of this text will be very different from what you might have experienced in an introduction to programming course, if you had one. The questions that we will ask of each other and of the data will be more open-ended. It is no longer a matter of only computing the mean or median of some metric, but of exploring all the data available to us, sometimes across multiple datasets, excluding outliers, and finding interesting groupings or associations within them. This also means that, frequently, the answers to these questions will not be a clear “yes” or “no”, but something much more subjective and open to analysis. That can be frustrating at times, but that is reality of the messy world we live in (and the messy data we extract from it).
This means that the learning zone you may have heard of are very much going to be key. Computers are still very reliable, and very quick, but not creative. As you apply more powerful tools to problem solving, you will find that some things that might have been hard with basic Python are now easy, allowing you to perform certain tasks in your comfort zone. However, new tools also mean new ways for them to fail or produce unexpected results. This will hopefully push you into your learning zone where you will discover your ability to perform complex analyses to solve real-world problem.
There is another definition of the learning zone that is related to what we have been talking about. In this amazing TED talk: How to get better at the things you care about, Eduardo Briceño talks about the “performance zone” versus the “learning zone.” Please watch it.
The big takeaway for you is that as a student in a classroom using this text, you are in the learning zone as Briceño defines it. You are not being judged or graded for how quickly you arrive at an answer or not. The classroom for this course is a time for you to practice old skills, try new skills, and to fail without repercussions; that is how we learn! You will spend a huge amount of the rest of your life in the performance zone, so take advantage of this opportunity and enjoy the chance to be in the learning zone.
If you find yourself in the panic zone, please seek help from your instructor and/or classmates. None of the activities in this book are intended to stump you. As you understand how to solve some simpler problems, you will develop the ability to join these solutions together to solve increasingly challenging problems with real-world applications.
1.1.9. Datasets in this Book
Every chapter in this book uses data. The data that we use is real world data representing real world problems. This is far more interesting, and complex, than the toy data sets you might find elsewhere. It also reminds you that real-world examples are often messier than the carefully crafted examples you might encounter in other courses or books.
When using real data, it is important to make sure that the data is licensed in a way that is appropriate for your intended use. For example, the CIA World Factbook data is licensed in the “public domain”, which allows you to use the data any way one might want. You could even package the CIA data in an application for a phone and sell that application on the app store. If you search, you will see there is more than one such app! Another data set called the Twitter US Airline Sentiment data set is used in several different data science textbooks, and is licensed using the Creative Commons CC-BY-NC-SA license. This license allows you to use the data, share the data, and adapt the data for your own purposes as long as you give credit to the original source, share any modifications you make to the data under the same license, and it restricts you from using the data for commercial purposes (to make money). So you could not use the airline tweet data in an app that charges users for airline recommendations.
Since this textbook is educational, open source, and free, we believe that we are not using the data for commercial purposes. So although we try to find datasets that are in the public domain, or are CC-BY only, many interesting data sets do have the non-commercial restriction. We will still use those datasets, and we will point out their restrictions in each chapter as we explore the data. In some cases, we’ve even gone the extra mile to seek out the publisher of the data set and get explicit permission to use the data.
This book itself is licensed CC-BY-SA. That means other instructors or authors are free to take this book as a starting point, add new material, change the examples we use if they want, remove material that isn’t relevant, as long as they give us credit as the original source, and license their version of the textbook using the CC-BY-SA license. It also means that this book is freely available for you and anyone else who wants to read it, without paying for it.
Copyright laws are complicated, so please don’t take anything written above as legal advice. You can learn more about copyright law and the creative commons work to help simplify the law on the creative commons website.
1.1.10. How to Use This Book
This book is designed to be used in conjunction with external tools like Google Sheets and Google Colaboratory or Jupyter Notebooks. You will need to move back and forth between browser tabs as you work with the tools, and follow the instructions in the book. You will be asked to answer the questions in the book as you read. This is to encourage you to type in the code we have provided and experiment with it. Learning computer science, data science, or data analytics is not a spectator sport. Many students make the mistake of thinking that they can just read about it and understand it. You really have to do it in order to understand it. Imagine trying to learn to play a sport or a musical instrument by only reading about it and not trying it… It simply would not work. So, please don’t cheat yourself by failing to try and don’t guess at the answers to the questions in the book.
Everything you learn in this textbook builds on and reinforces the things you have learned previously. If you do fall behind, make sure you talk to your instructor so you can develop a strategy for catching up.