
11.6. Wealth Inequality
In its current form, Sugarscape models a simple ecology, and could be used to explore the relationship between the parameters of the model, like the growth rate and the attributes of the agents, and the carrying capacity of the system (the number of agents that survive in steady state). And it models a form of natural selection, where agents with higher “fitness” are more likely to survive.
The model also demonstrates a kind of wealth inequality, with some agents accumulating sugar faster than others. But it would be hard to say anything specific about the distribution of wealth because it is not “stationary”; that is, the distribution changes over time and does not reach a steady state.
However, if we give the agents finite lifespans, the model produces a stationary distribution of wealth. Then we can run experiments to see what effect the parameters and rules have on this distribution.
In this version of the model, agents have an age that gets incremented each time step, and a random lifespan chosen from a uniform distribution between 60 to 100. If an agent’s age exceeds its lifespan, it dies.
When an agent dies, from starvation or old age, it is replaced by a new agent with random attributes, so the number of agents is constant.
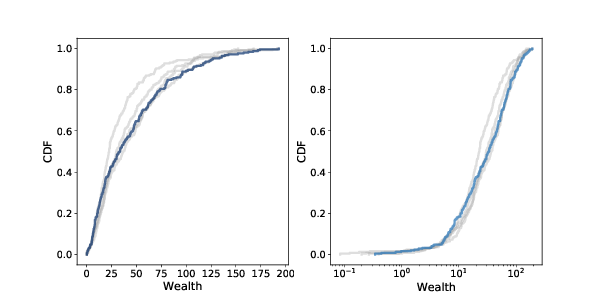
Figure 11.4: Distribution of sugar (wealth) after 100, 200, 300, and 400 steps (gray lines) and 500 steps (dark line). Linear scale (left) and log-x scale (right).
Starting with 250 agents (which is close to carrying capacity) we can run the model for 500 steps. After each 100 steps, plotting the cumulative distribution function (CDF) of sugar accumulated by the agents. We saw CDFs in Section 6.8. Figure 11.4 shows the results on a linear scale (left) and a log-x scale (right).
After about 200 steps (which is twice the longest lifespan) the distribution doesn’t change much. And it is skewed to the right.
Most agents have little accumulated wealth: the 25th percentile is about 10 and the median is about 20. But a few agents have accumulated much more: the 75th percentile is about 40, and the highest value is more than 150.
On a log scale the shape of the distribution resembles a Gaussian or normal distribution, although the right tail is truncated. If it were actually normal on a log scale, the distribution would be lognormal, which is a heavy-tailed distribution. And in fact, the distribution of wealth in practically every country, and in the world, is a heavy-tailed distribution.
It would be too much to claim that Sugarscape explains why wealth distributions are heavy-tailed, but the prevalence of inequality in variations of Sugarscape suggests that inequality is characteristic of many economies, even very simple ones. And experiments with rules that model taxation and other income transfers suggest that it is not easy to avoid or mitigate.