
Describing Scatter Plots
In this section you will learn how to identify the relationship between variables in a scatterplot. These variables are the explanatory and the explained variable that were defined earlier in the scatterplots section. The following activities ask you to examine the scatterplots pictured and then match them with their description.
E
-
Correct: Most adults make more money as they get older, but many other factors such as education and career also impact salary.
A
-
Incorrect
D
-
Incorrect
F
-
Incorrect
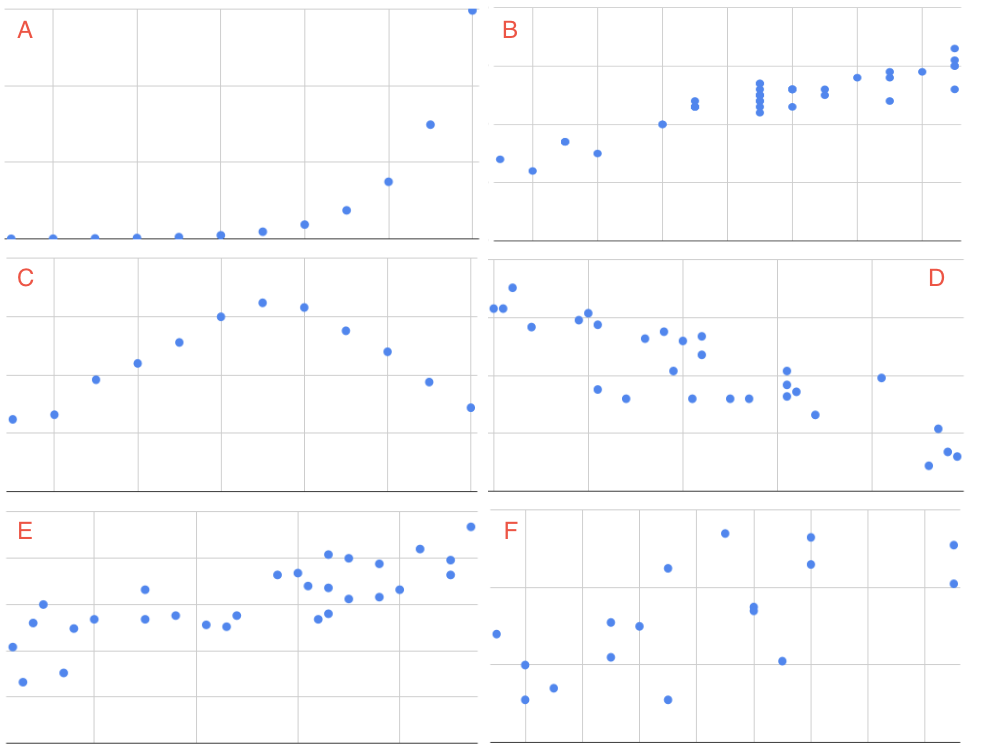
Q-1: The explanatory variable (x) is age in years and the explained variable (y) is the annual salary for a sample of working adults between the ages of 18 and 65.
F
-
Correct: There’s no real relationship between height and commute time.
A
-
Incorrect
D
-
Incorrect
B
-
Incorrect
Q-2: The explanatory variable (x) is the mean commute time in minutes and the explained variable (y) is height in inches for a sample of employees at a small company.
C
-
Correct: Cold winters and warm summers means smaller values close to the end points 1 = January and 12 = December, and higher temperatures in the middle.
A
-
Incorrect
D
-
Incorrect
B
-
Incorrect
Q-3: The explanatory variable (x) is the month of the year, starting in January, and the explained variable (y) is the mean temperature for that month for St. Louis, Missouri which has cold winters and warm summers.
C
-
Incorrect
A
-
Incorrect
D
-
Incorrect
B
-
Correct: Cars with higher city mpg also have higher highway mpg.
Q-4: The explanatory variable (x) is the city miles per gallon and the explained variable (y) is the highway miles per gallon for a sample of cars.
C
-
Incorrect
A
-
Correct: Because the number of cells is doubling, the change every 20 minutes at the beginning of the experiment is small compared to the change every 20 minutes at the end of the experiment when there are much more cells dividing.
D
-
Incorrect
B
-
Incorrect
Q-5: The explanatory variable (x) is the number of hours after e-coli has been introduced to a petri dish and the explained variable (y) is the estimated number of e-coli cells after t hours. The number of cells doubles about every 20 minutes.
C
-
Incorrect
A
-
Incorrect:
D
-
Correct: Drivers with more driving experience are considered safer, so they pay smaller premiums. Similarly, drivers with less driving experience are considered riskier and pay greater premiums.
B
-
Incorrect
Q-6: The explanatory variable (x) is the years of driving experience and the explained variable (y) is the insurance premium paid for a sample of drivers.
This exercise would be simpler given uniform adjectives that everyone could understand. When describing the shape of the scatter plot and the relationship between the explanatory and explained variable, there are three important features to discuss.
The direction of a scatter plot can be described as positive or negative. The direction is positive when the explained variable increases as the explanatory variable increases, or the points of the scatterplot go up from left to right. The direction is negative when the explained variable decreases as the explanatory variable increases, or the points of the scatterplot go down from left to right.
The strength of a scatter plot is usually described as weak, moderate or strong. The more spread out the points are, the weaker the relationship. If the points are clearly clustered, or closely follow a curve or line, the relationship is described as strong.
The linearity of scatter plot indicates how close the points are to a straight line. Scatter plots are described as linear or nonlinear.
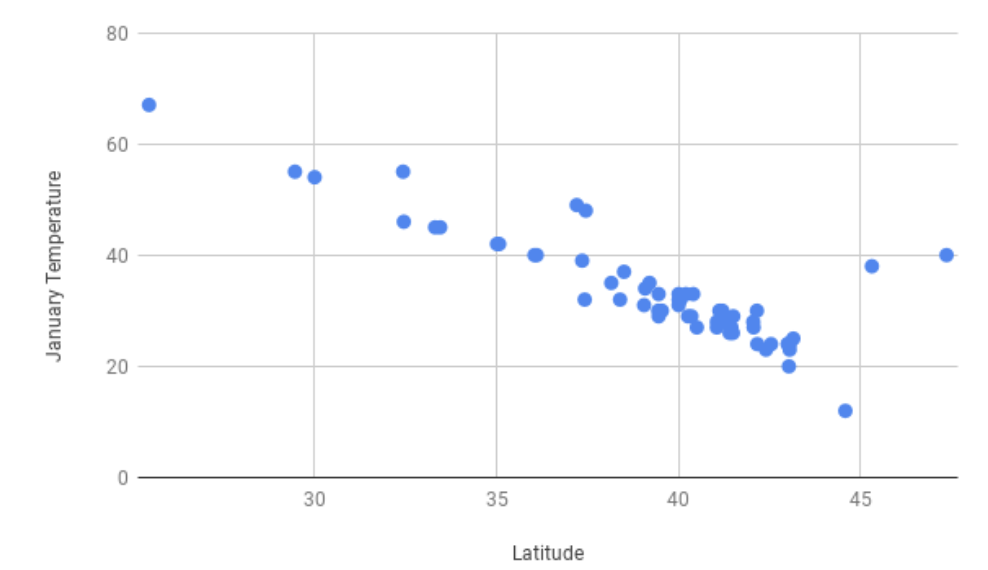
For example, the scatterplot of latitude and January temperatures had negative direction, as the greater the latitude, the colder the temperature. Though there are a few outliers (cities along the northwest coast of the US that have temperate winters, such as Portland, OR) there is a strong, linear trend.
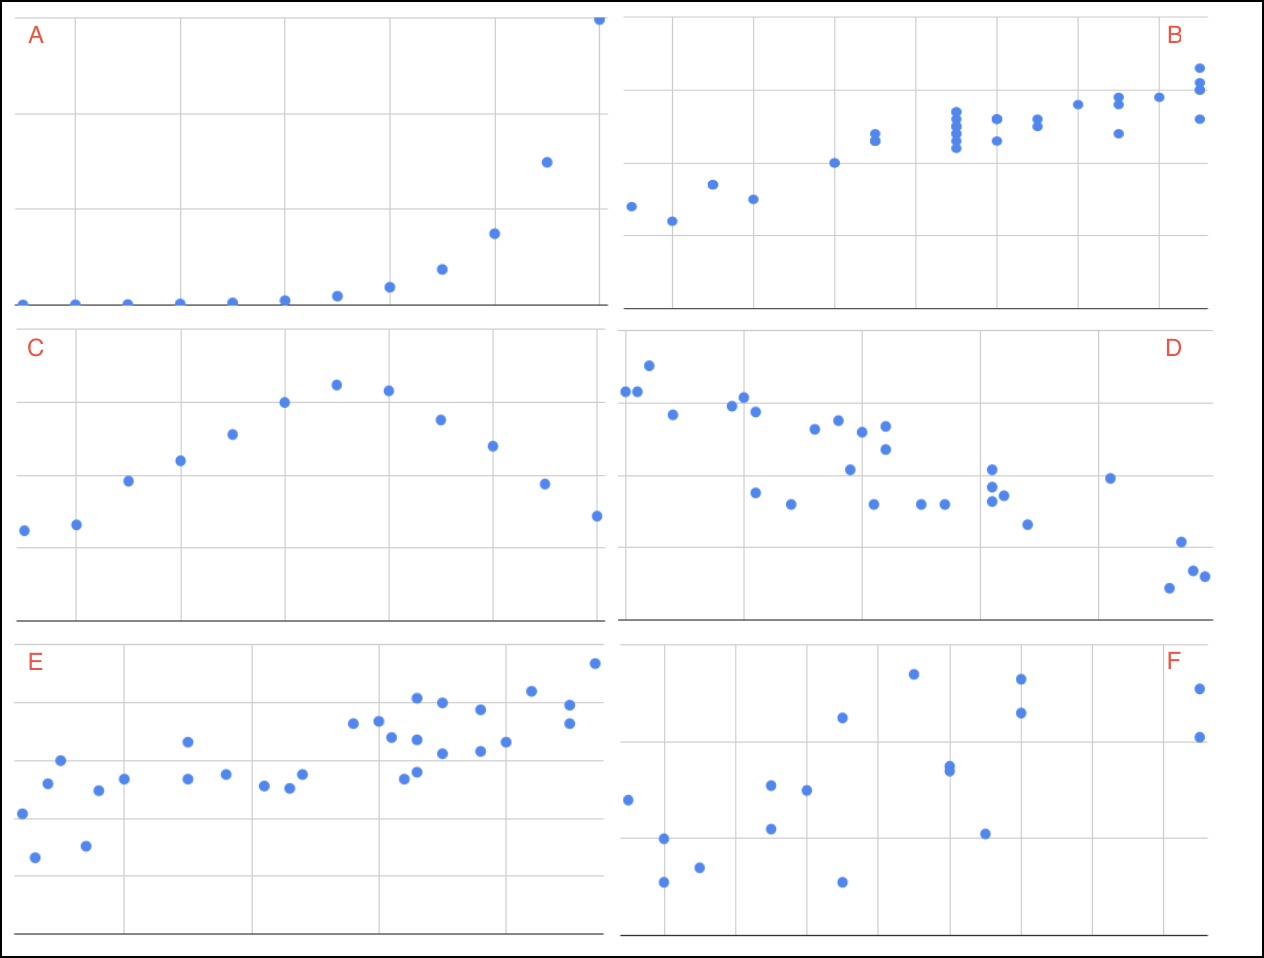
Given a new set of scatterplots below, repeat the same exercise, but now with the new descriptions of strength, linearity and direction.
-
Q-7: Match each scatterplot above with its description.
Try again!
- A
- Positive, strong, nonlinear
- B
- Positive, strong, linear
- C
- Neither positive nor negative, strong, nonlinear
- D
- Negative, moderate, linear
- E
- Positive, moderate, linear
- F
- No relationship