
Correlation
The correlation coefficient is a measure of the strength and direction of the linear relationship between two quantitative variables. It is denoted as r, and is always between -1 and 1. Here are some examples of scatterplots and their corresponding correlation coefficients.
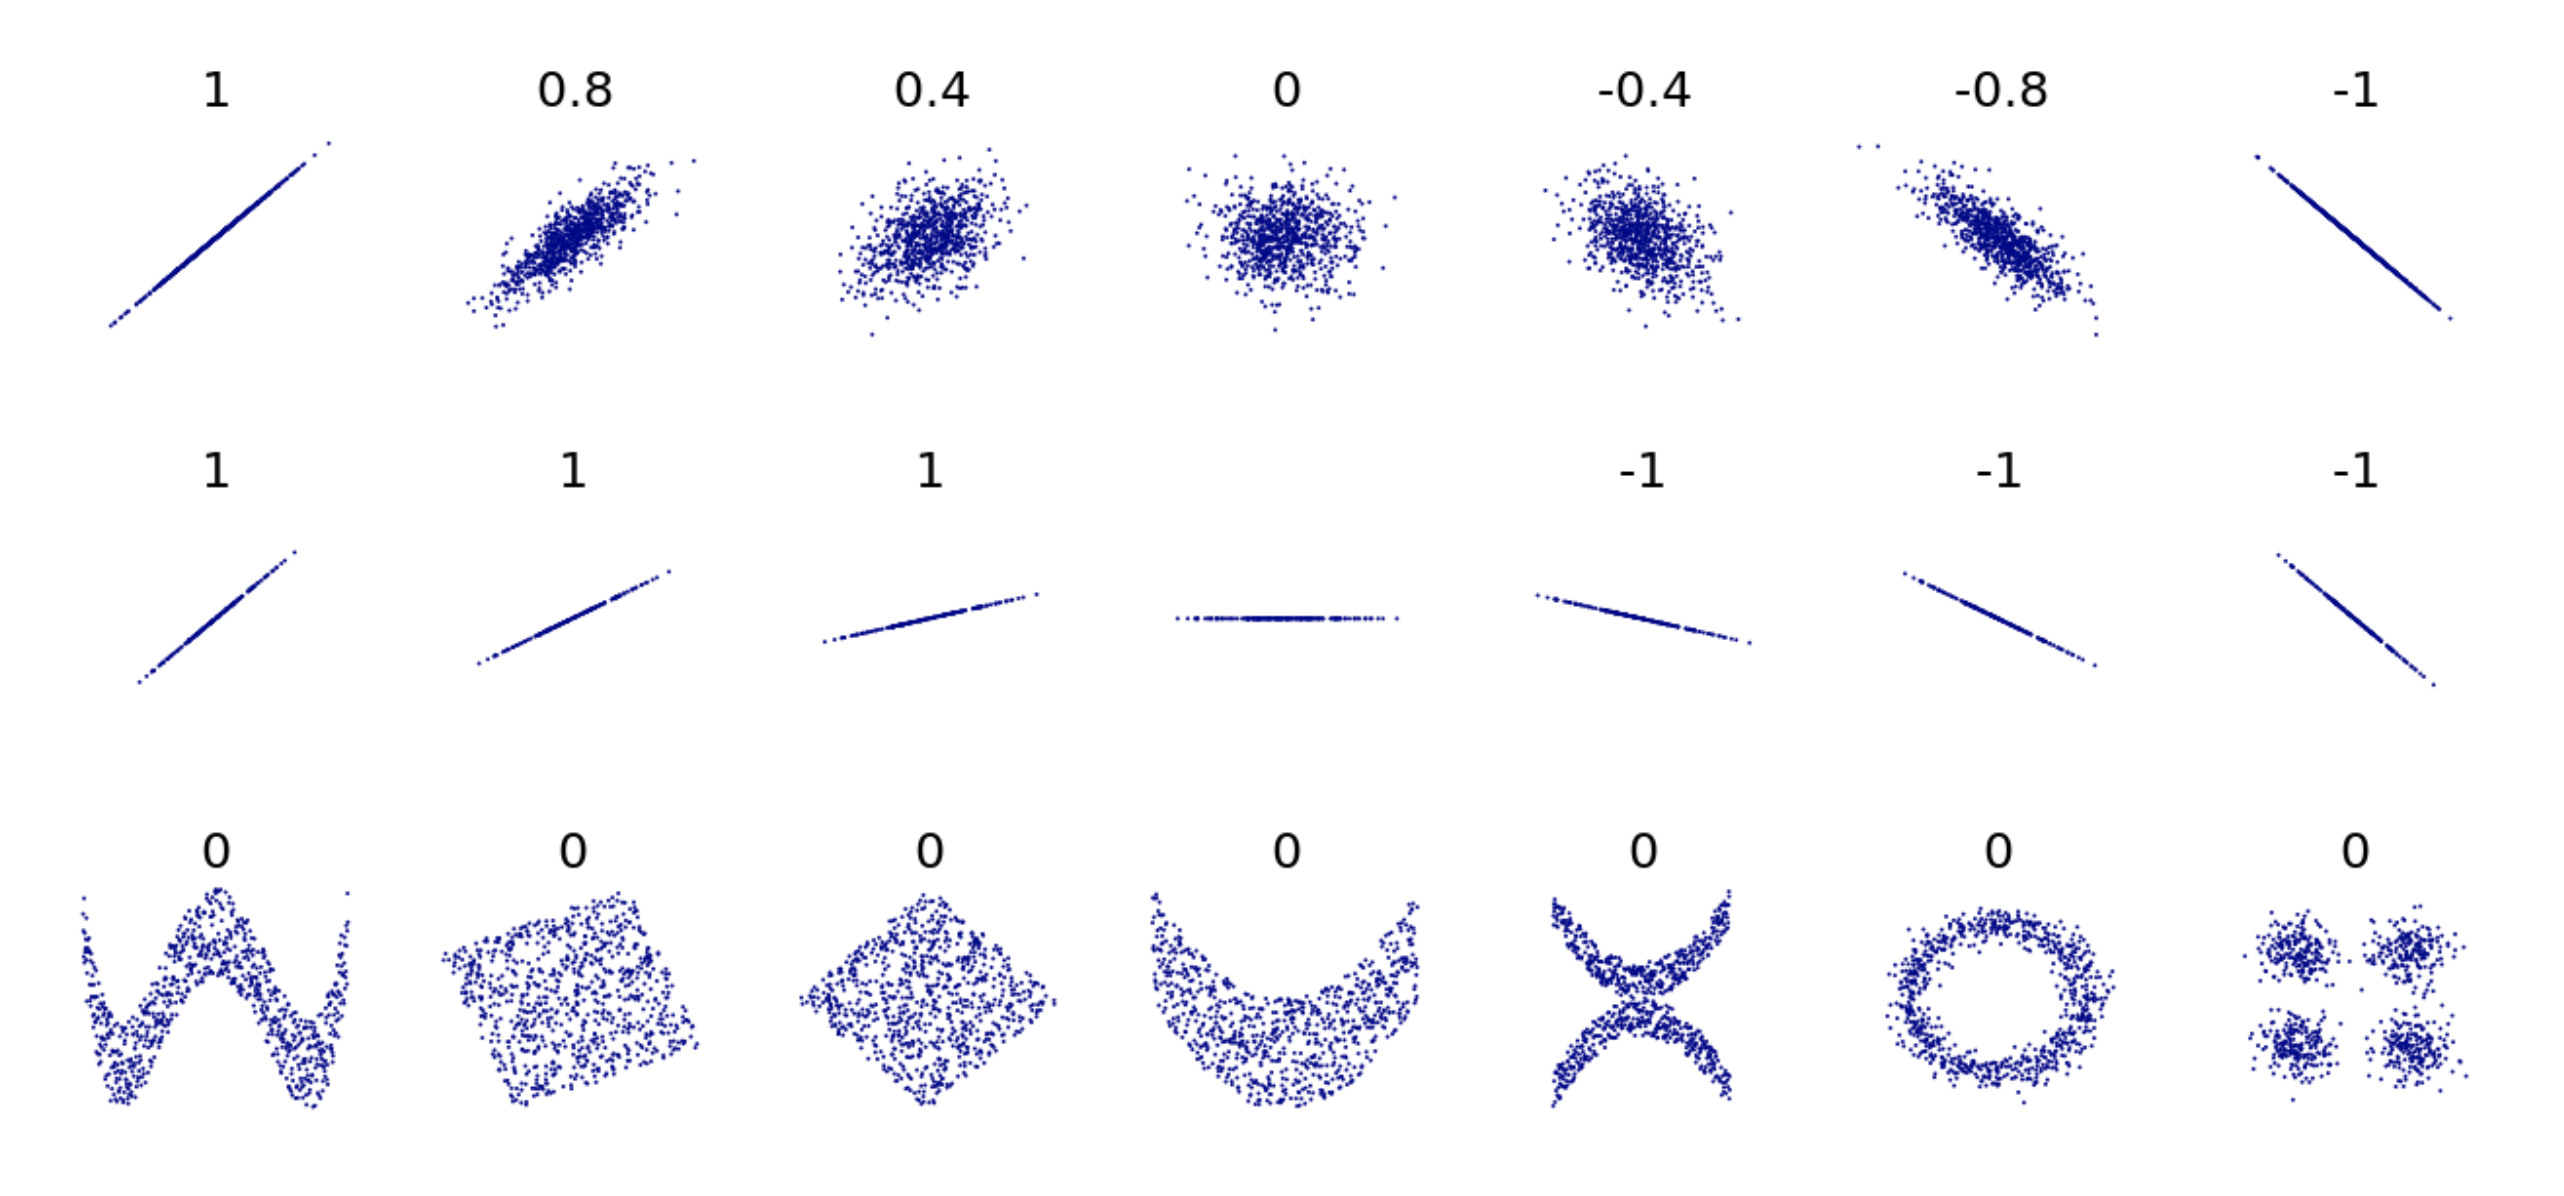
As you can see, in the first row of the examples above, the closer the points are to lying on a straight line, the closer the correlation is to either 1 or -1. If the scatter plot has a positive direction, the correlation is a positive number, and if the scatter plot has a negative direction, the correlation is a negative number.
Correlation only measures the strength of linear relationships between variables. The last row of examples shows a variety of scatter plots where there is clearly an interesting relationship between the two variables (note all the unique shapes!), but the correlation is 0 because the relationship is nonlinear. Read this for more detail about how correlation is calculated.
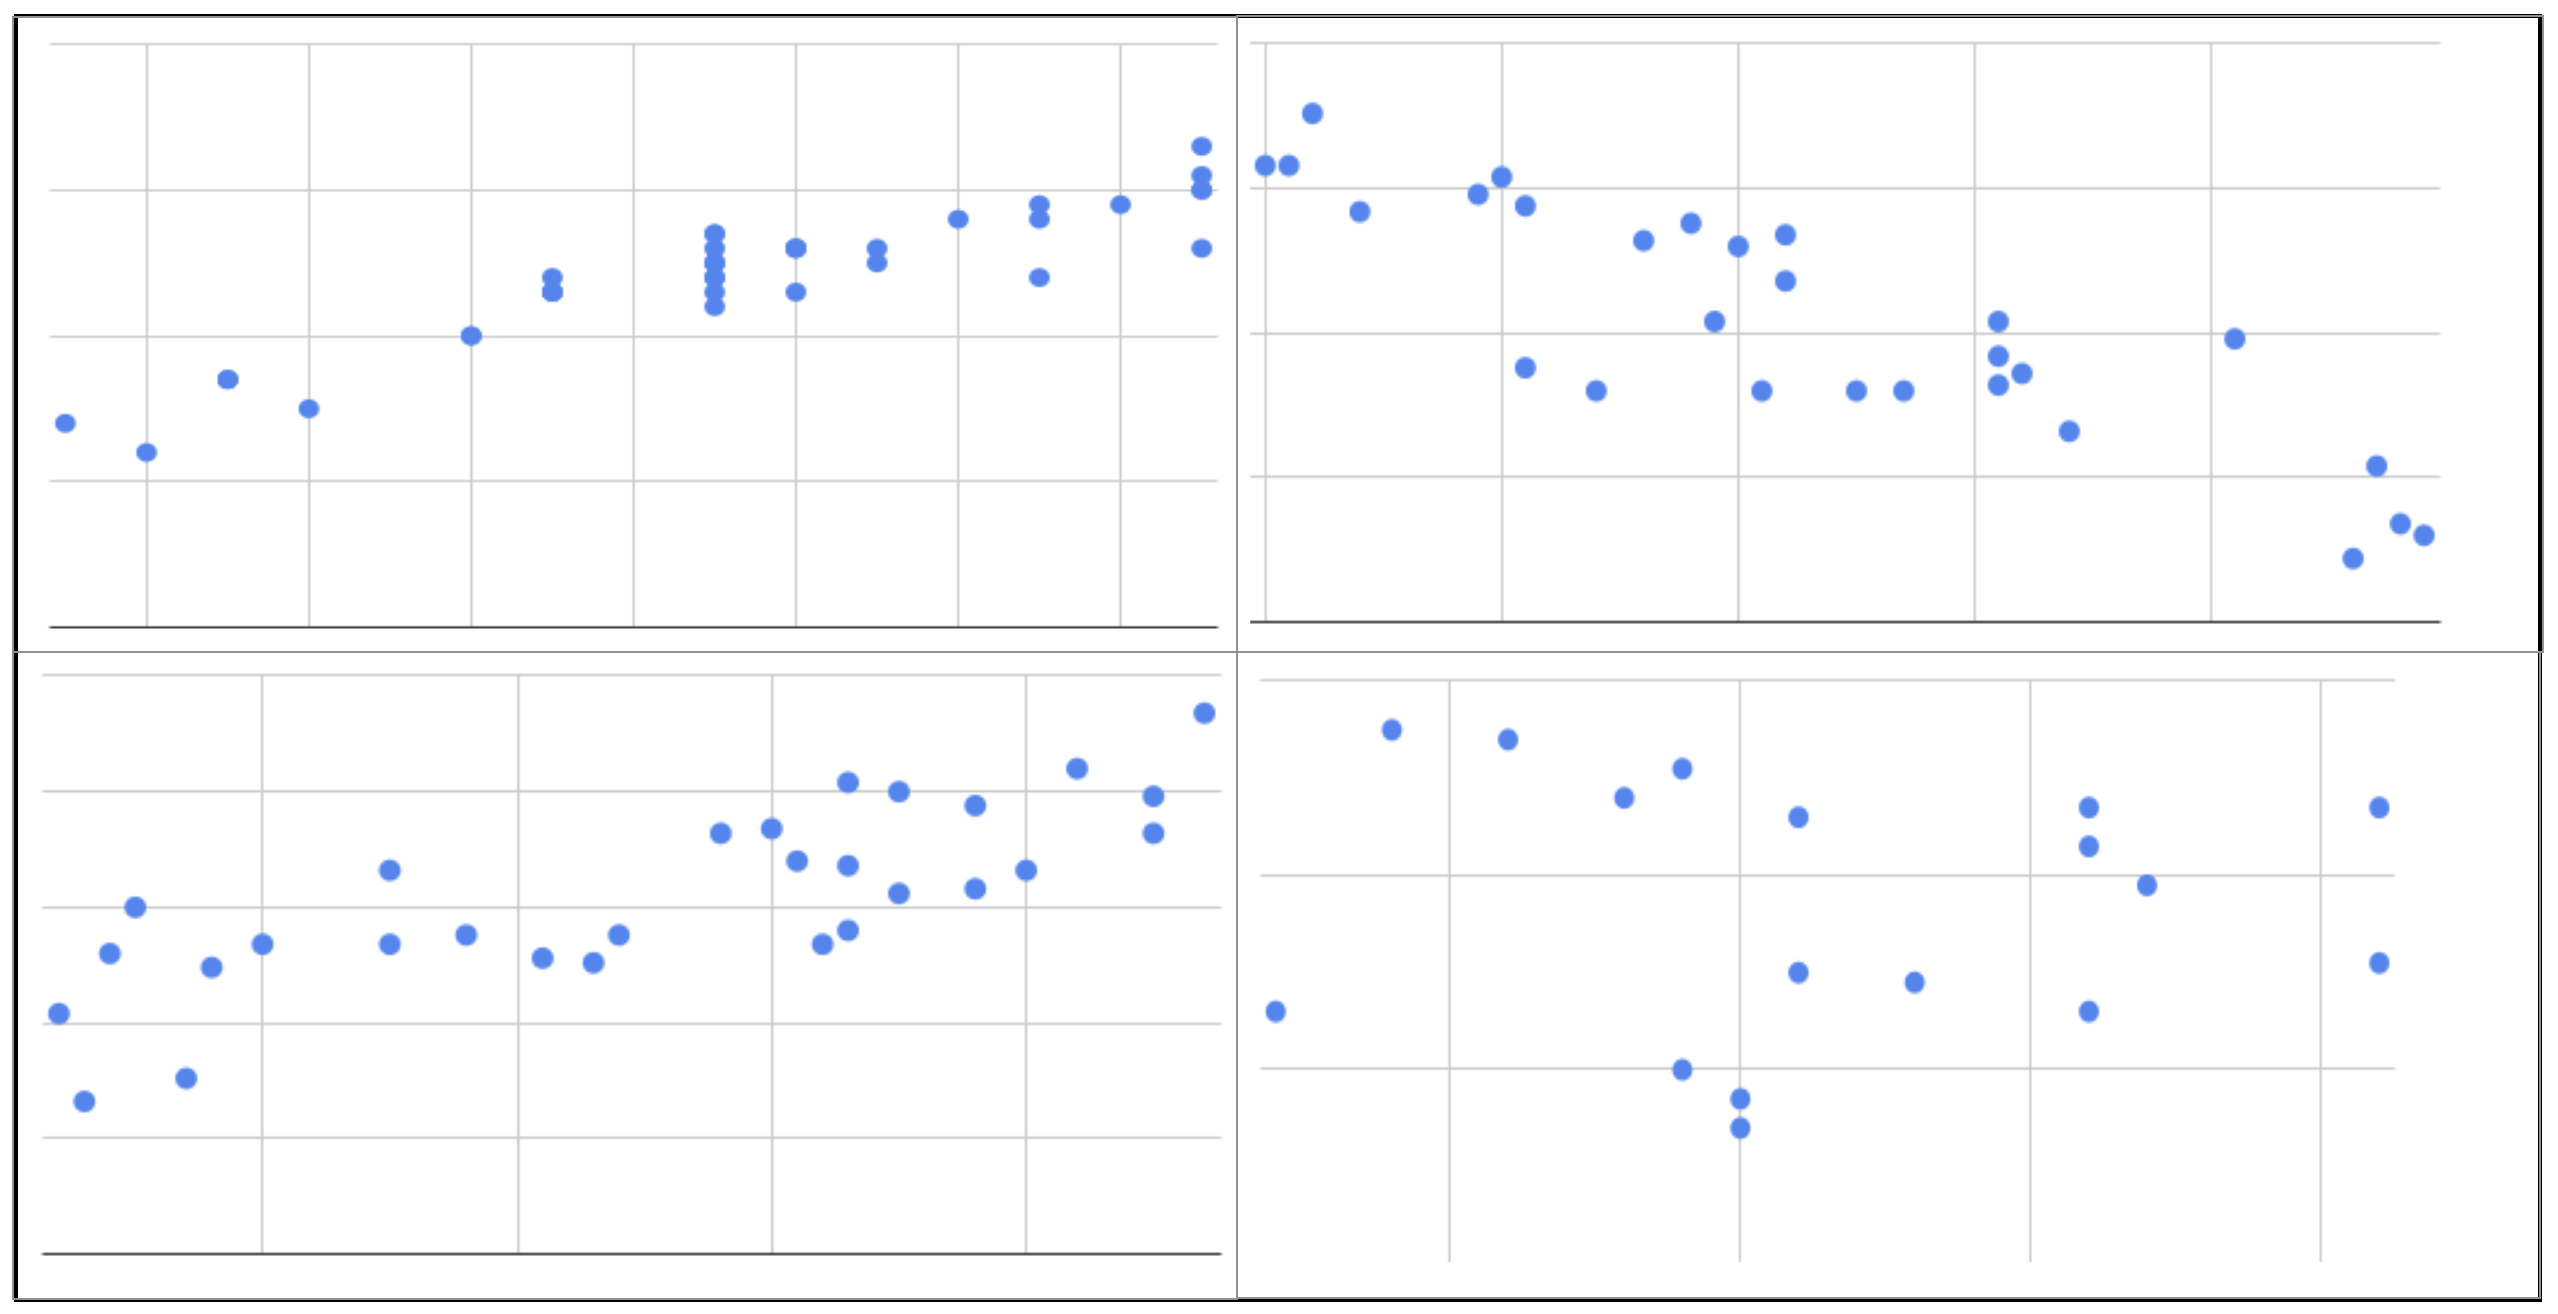
Question: Using the above figure as a guide, match the correlation to each of the scatterplots from previous questions.
-
Q-1: Using the above figure as a guide, match the correlation to
each of the scatterplots from previous questions.
Try again. Top left has a negative and strong correlation. Top
right has a positive and strong correlation. Bottom left has
no real relationship, and bottom right has a positive
and strong correlation.
- 0.79
- Bottom left
- 0.02
- Answer B
- -0.83
- Top left
- 0.92
- Top right
You can use Sheets to find correlation using the CORREL function.
Video - how to find correlation in sheets.
A common, related value is r^2, called the coefficient of determination. **The coefficient of determination is the proportion of variation explained by the explanatory variable. **It can be calculated by squaring the correlation coefficient. The closer r^2 is to 1, the closer r was to either 1 or -1, and thus the stronger the relationship between the variables. The coefficient of determination is useful when you’re only interested in strength, rather than strength and direction.
Q-2: Which would have the largest \(r^2\) value?
- 0.7
- -0.1
- 0.9
- 0.05
Q-3: Which of the following r values would have the largest \(r^2\) value?