
Minimum and Maximum
The minimum and maximum of a dataset can be very useful statistics, and are relatively simple to calculate. These statistics only apply to quantitative variables.
Minimum Definition
The minimum value is the smallest value in the dataset, or the value that all other values in the dataset are greater than or equal to.
Maximum Definition
The maximum value is the largest value in the dataset, or the value that all other values in the dataset are less than or equal to.
The minimum or maximum value is sometimes the only value you need to know. For example, suppose your university has organized a field trip for your class to a concert, but the event is at a 21+ venue so people under the age of 21 are not allowed in. In this case, knowing that the minimum age of the students in your class is 21 is sufficient, as that tells you that everyone in the class is at least 21 and that all members of the class can go on the field trip.
Example: Dice Roll
Consider rolling a standard dice.
There are six faces.
Each face is equally likely to land face up.
The faces are labelled as follows: 1, 2, 3, 4, 5, 6.
It might seem unnecessary to use Sheets to calculate the minimum and maximum possible results of a dice roll, but when there are thousands of values instead of six, using Sheets or some other tool will be a necessity.
You can calculate the minimum and maximum value in Sheets using the MIN and
MAX functions respectively.
Minimum and Maximum in Sheets
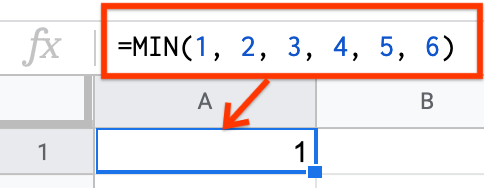
The MIN function returns the minimum value of a set of values. You can
either input several values separated by a comma (e.g.
=MIN(value1, value2, value3)), or you can input a range of cells of which
you want to know the minimum (e.g. =MIN(A1:A10)).
The MAX function returns the maximum value of a set of values. You can
either input several values separated by a comma (e.g.
=MAX(value1, value2, value3)), or you can input a range of cells for
which you want to know the maximum (e.g. =MAX(A1:A10)).
This example illustrates how to calculate the minimum value of a dice roll using
MIN, but the exact same logic and syntax applies to calculating the maximum
using MAX. As stated above, there are two ways to calculate the minimum
value of a dice roll.
In the first way, each value is input into the MIN function, separated by a
comma.
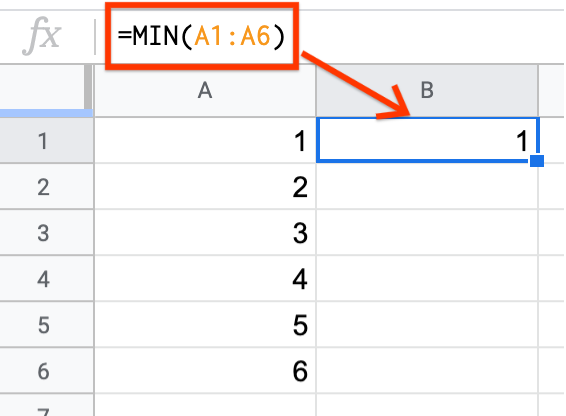
Alternately, you can specify all the values in different cells, and input the
cell range into the MIN function.
In future examples, you will see that specifying a cell range is the more
efficient way to use MIN, MAX, and other statistical functions.
Example: Weather
Suppose you want to know the minimum and maximum temperature that New York City (NYC) generally experiences in a year.
The weather dataset previously seen here has the field “actual_min_temp” which records the coldest temperature every day, and a field “actual_max_temp” which records the highest temperature every day. (For this example, only NYC weather is considered so the “city” column is removed, and the month is not relevant so the “month_text” column is removed.)
Q-1: What is the coldest minimum temperature reached in NYC for the twelve months?
Q-2: What is the warmest maximum temperature reached in NYC for the twelve months?
This dataset for twelve months contains just 365 data points. It would be time-consuming but not impossible to scan each column visually and find the minimum and maximum values. But imagine if this dataset covered every day for one-hundred years! Sheets would be able to find the minimum and maximum just as quickly as it did for twelve months. Doing this manually, however, is error-prone and would not be fun.
Optional: Match
Knowing how to find the minimum and maximum values in a spreadsheet is useful for many situations, but sometimes it can be even more useful to know which row the minimum or maximum came from.
Match Definition
MATCH returns the relative position of an item in a range that matches a
specified value. We can use the MATCH function to find the row of the
minimum or maximum.
The MATCH function has three inputs and looks like this:
MATCH(search_key, range, [search_type]).
search_key: The value to search forrange: The values of the column that you want to search (ex. A1:A5)search_type: The manner in which to search1 causes
MATCHto assume that the range is sorted in ascending order and return the largest value less than or equal to search_key0 indicates an exact match, and is required when the range is not sorted
-1 causes
MATCHto assume that the range is sorted in descending order and return the smallest value greater than or equal tosearch_key
To practice using MATCH, suppose a company called CandyData handed you the
Halloween Candy dataset from FiveThirtyEight with information about various
Halloween candies. Suppose they ask you to find out which of the candies is most
expensive. You know that you need to find the row with the highest value in the
Price Percent column, so you can use the MATCH function!
Now you must start filling in the inputs for MATCH. The first input is the
value you’re searching for. You’re looking for the maximum value in the column,
and you know that to find the maximum value in a column you can use the MAX
function (MAX(C2:C86)). So now you can fill in the first part of the
MATCH function: MATCH(MAX(C2:C86), something, something).
The second input is the range of the values of the column that you want to
search. Since you want to find the value in the column called Price Percent,
you fill in the next part of the MATCH function: MATCH(MAX(C2:C86), C1:C86,
something).
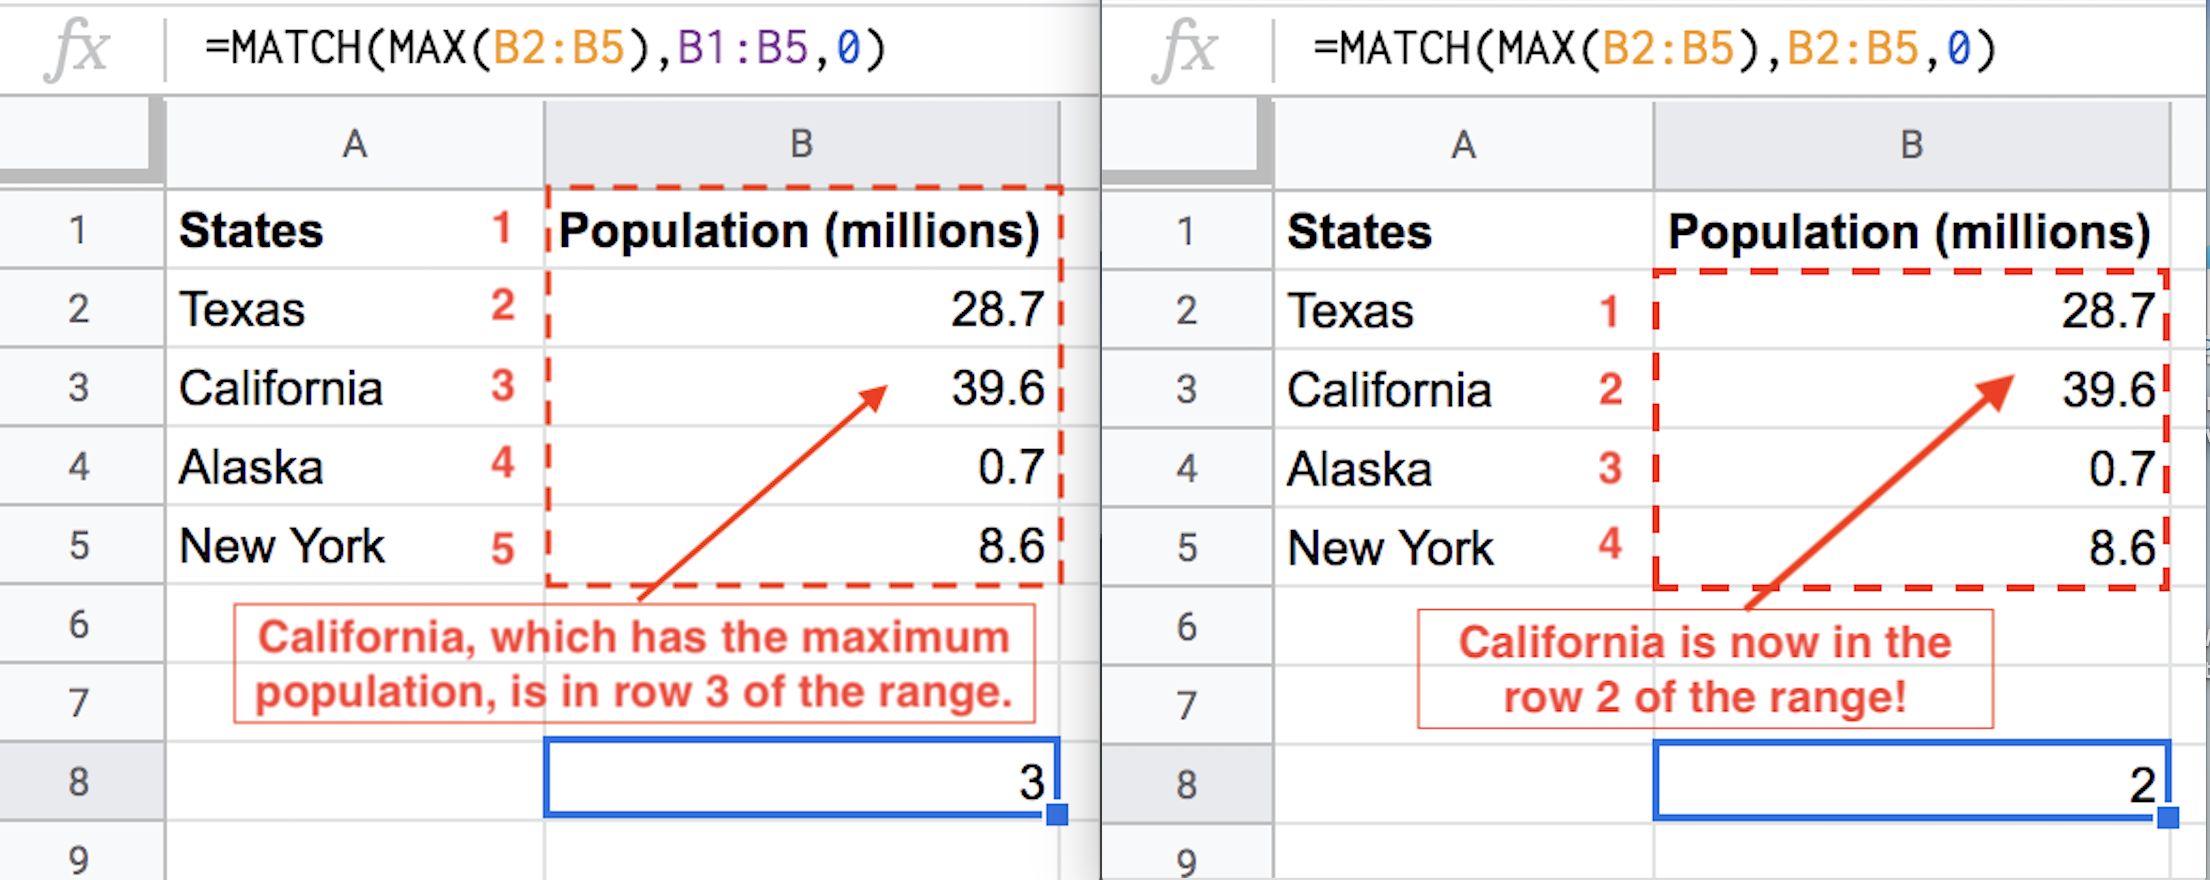
Notice that if you use C2:C86 instead of C1:C86 instead, the row value
returned by the function will be shifted up by one, so the answer will be 53
instead of 54. This is because the returned value is equal to how far down the
value is in the range, so when you omit the first row in the range (C1),
the returned value will be one less than the row number because it’s counting
the rows starting at C2.
This is what that bug would look like if you were using a smaller dataset and trying to find the state with the largest population:
The last input is the manner in which you want to search. Since the values in
Price Percent aren’t sorted, you use 0. The final function is
=MATCH(MAX(C2:C86), C1:C86, 0). The returned value is 46, meaning the most
expensive candy is in row 46. You can now go back CandyData and tell them that
“Nik L Nip” is the most expensive candy on the dataset.
Practice using the MATCH, MAX, and MIN functions to answer the
following questions:
Q-3: Which is the least expensive Halloween candy?
Q-4: Which Halloween candy has the highest sugar percentage?
Q-5: What is the most popular Halloween candy?
Q-6: What is the least popular Halloween candy?